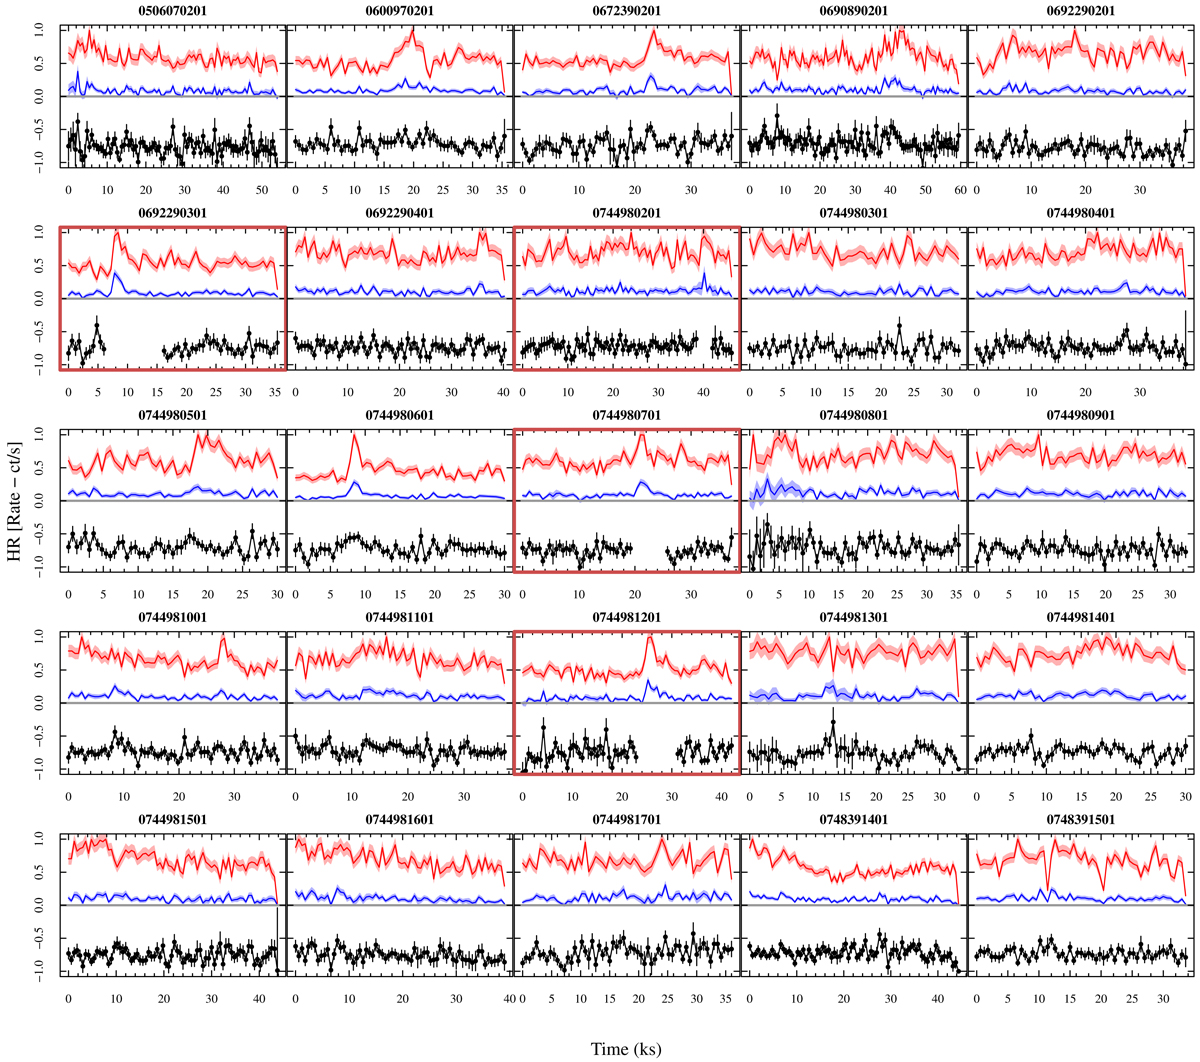
Fig. B.1.
Download original image
Solid black lines with error bars: light curves of hardness ratio of HD 189733 A obtained from pn events for each observation. Red and blue curves: Soft (0.3-1.0 keV) and hard (1.0-2.0) band light curves scaled between zero and the maximum of soft rate. As in Fig. B.2, the panels marked with a red border indicate observations where flares of HD 189733 B were detected. In these curves, we discarded the intervals relative to the flares of HD 189733 B.
Current usage metrics show cumulative count of Article Views (full-text article views including HTML views, PDF and ePub downloads, according to the available data) and Abstracts Views on Vision4Press platform.
Data correspond to usage on the plateform after 2015. The current usage metrics is available 48-96 hours after online publication and is updated daily on week days.
Initial download of the metrics may take a while.