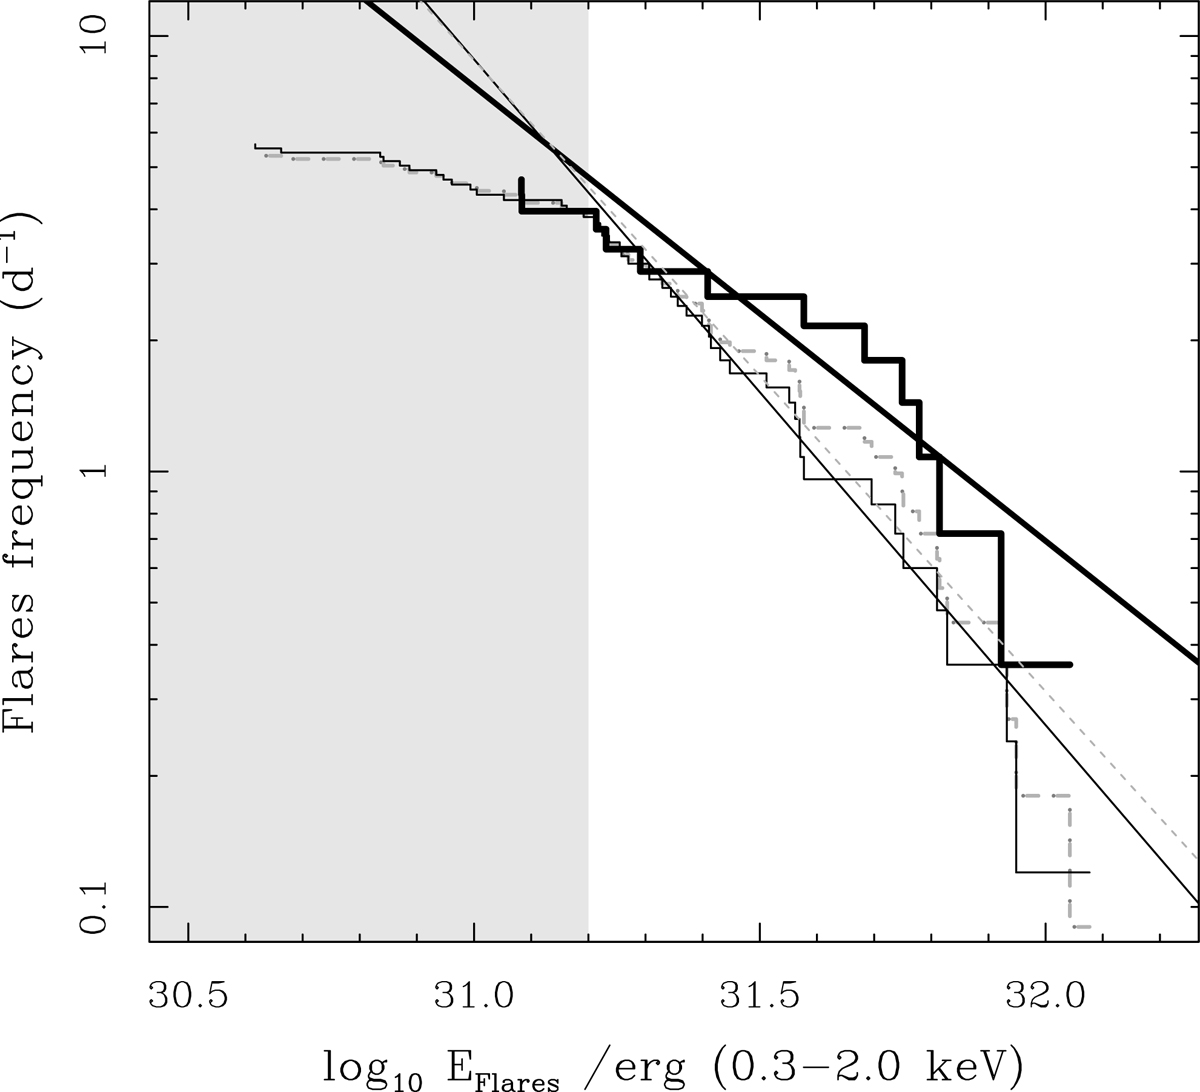
Fig. 8.
Download original image
Cumulative distributions of flares per day with energies above a given threshold (log N(E > E0)). Dashed line indicates the full sample of flares (Nflares = 60); thin solid line is relative to the flares observed at planetary transits (Nflares = 47); thick solid line is relative to the flares observed at secondary transits (Nflares = 13). The lines refer to a linear fit of each sample in the form log N(EX > E0)∝βlog EX. The range with energies log EX < 31.2 not used for the fit to the slopes is shaded in gray color.
Current usage metrics show cumulative count of Article Views (full-text article views including HTML views, PDF and ePub downloads, according to the available data) and Abstracts Views on Vision4Press platform.
Data correspond to usage on the plateform after 2015. The current usage metrics is available 48-96 hours after online publication and is updated daily on week days.
Initial download of the metrics may take a while.