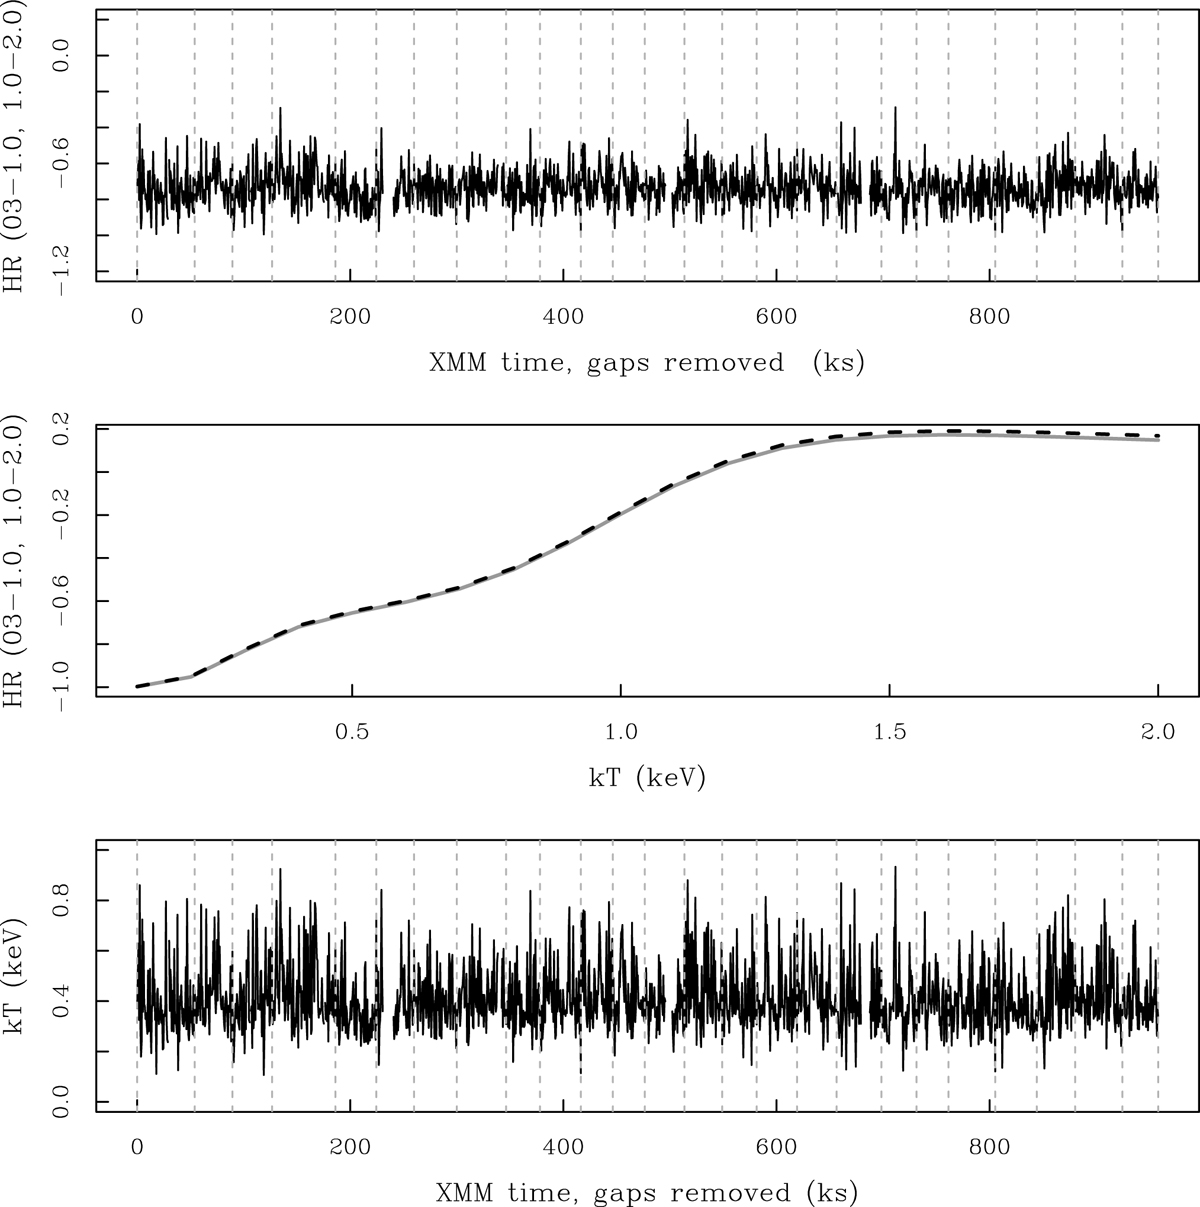
Fig. 5.
Download original image
Hardness ratio and coronal temperature. Top panel: time series of the hardness ratio (HR) calculated in the bands 0.3−1.0 keV (soft) and 1.0−2.0 keV (hard) as a function of the exposure time (bins of 600 s). Vertical lines indicate the durations of each XMM-Newton observation. The average uncertainty of HR is about 0.09 (quantile range 25%–75%: 0.08–0.11). Middle panel: relationship between HR and temperature (kT) derived with a library of synthetic spectra and XSPEC software for the case of Thin1 filter (solid line) and Medium filter (dashed line). Bottom panel: Time series of kT expressed in keV (average uncertainty is 0.09 keV, range 25%–75%: 0.07–0.12 keV).
Current usage metrics show cumulative count of Article Views (full-text article views including HTML views, PDF and ePub downloads, according to the available data) and Abstracts Views on Vision4Press platform.
Data correspond to usage on the plateform after 2015. The current usage metrics is available 48-96 hours after online publication and is updated daily on week days.
Initial download of the metrics may take a while.