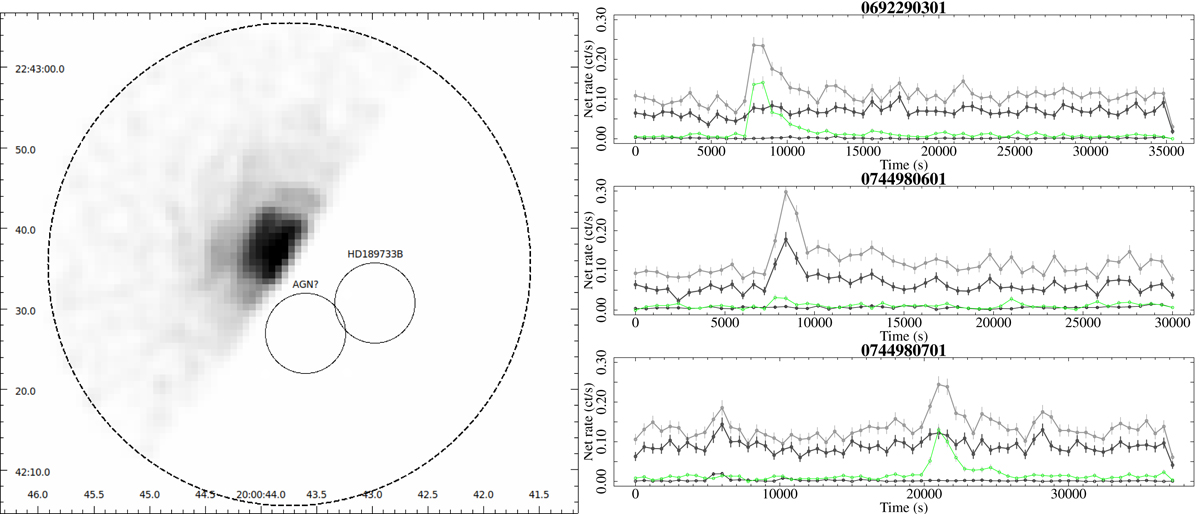
Fig. 3.
Download original image
Discriminating among different sources of variability. Left panel: pn image and selection of events of HD 189733 A in a semicircular region during observation 0744981201 in the band 0.3–2.0 keV. The circles indicate regions of size 5″. The large circle has radius 30″. Right panel: three examples of light curves where flaring of HD 189733 A or HD 189733 B is detected. The gray light curves are from events in a 30″ region minus two 8″ regions around HD 189733 B and source C (selection i + ii ). The time bins are 600 s each. The black light curves are accumulated from the events in the semicircular region opposite to HD 189733 B and source C as the figure in the left panel. Green light curves are made from the events of HD 189733 B in two 5″ regions. The background light curves scaled to the area of selection i + ii are also shown. In the top panel, a flare is visible both in the gray and green curves, but not in the black curve; this allows us to conclude that the flaring source was HD 189733 B and contaminated the selection in i + ii but not the selection in the semicircular region on the opposite side. In the middle panel, a flare is detected both in gray and black curves, this flare is genuinely due to HD 189733 A. In the bottom panel three flares are detected, the first one, seen in gray and black curves, attributed to HD 189733 A; while the second one is visible in gray and green curves and attributed to HD 189733 B. Another small flare of HD 189733 A is visible after the flare of HD 189733 B.
Current usage metrics show cumulative count of Article Views (full-text article views including HTML views, PDF and ePub downloads, according to the available data) and Abstracts Views on Vision4Press platform.
Data correspond to usage on the plateform after 2015. The current usage metrics is available 48-96 hours after online publication and is updated daily on week days.
Initial download of the metrics may take a while.