Free Access
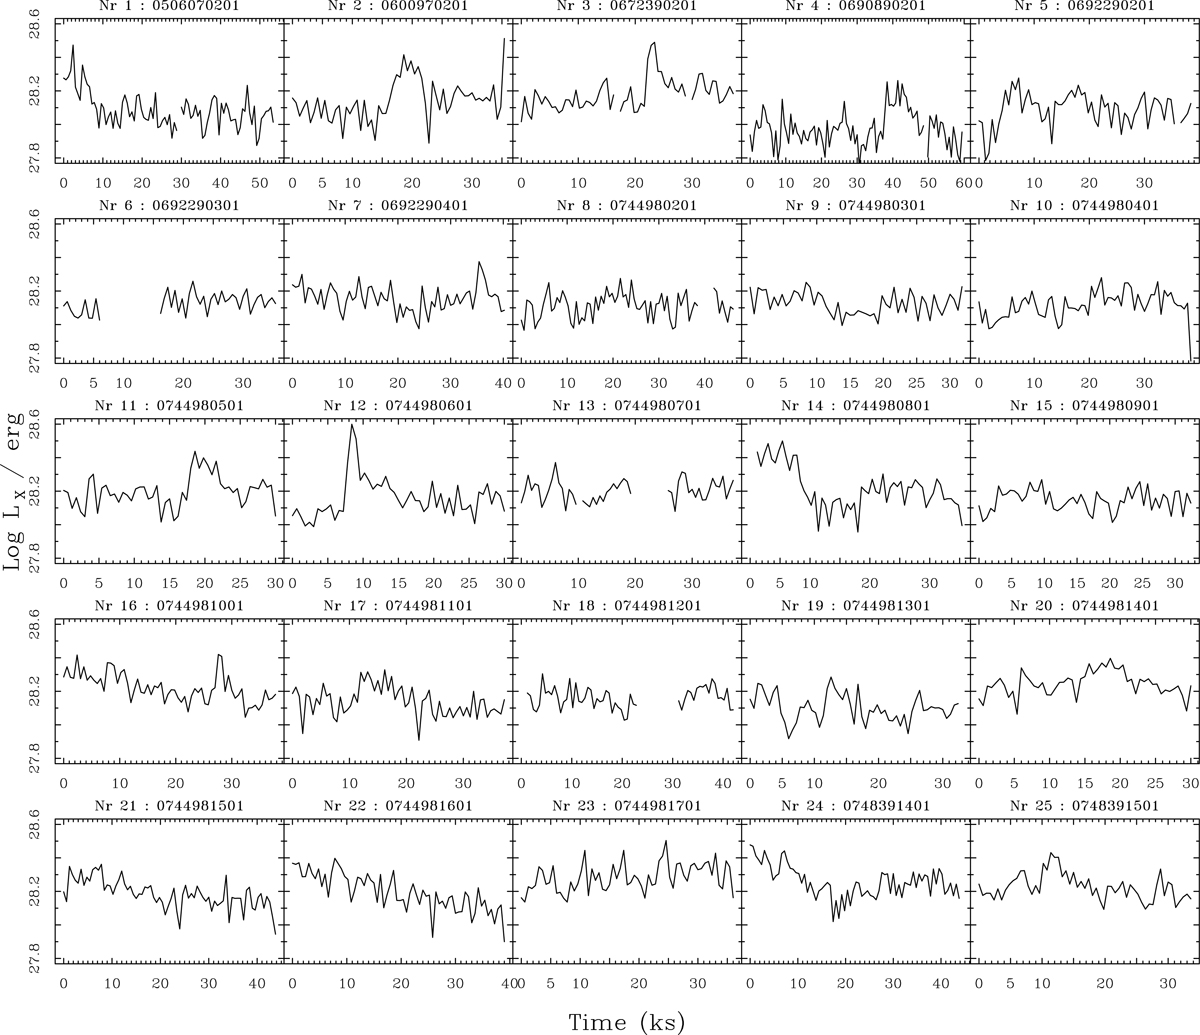
Fig. B.3.
Download original image
Synoptic plot of the logarithm of the X-ray luminosity of HD 189733 A in the band 0.3-2.0 keV observed in the XMM-Newton observations. Gaps in the light curves correspond to intervals where flares from HD 189733 B affected the estimated of the count rate of HD 189733 A.
Current usage metrics show cumulative count of Article Views (full-text article views including HTML views, PDF and ePub downloads, according to the available data) and Abstracts Views on Vision4Press platform.
Data correspond to usage on the plateform after 2015. The current usage metrics is available 48-96 hours after online publication and is updated daily on week days.
Initial download of the metrics may take a while.