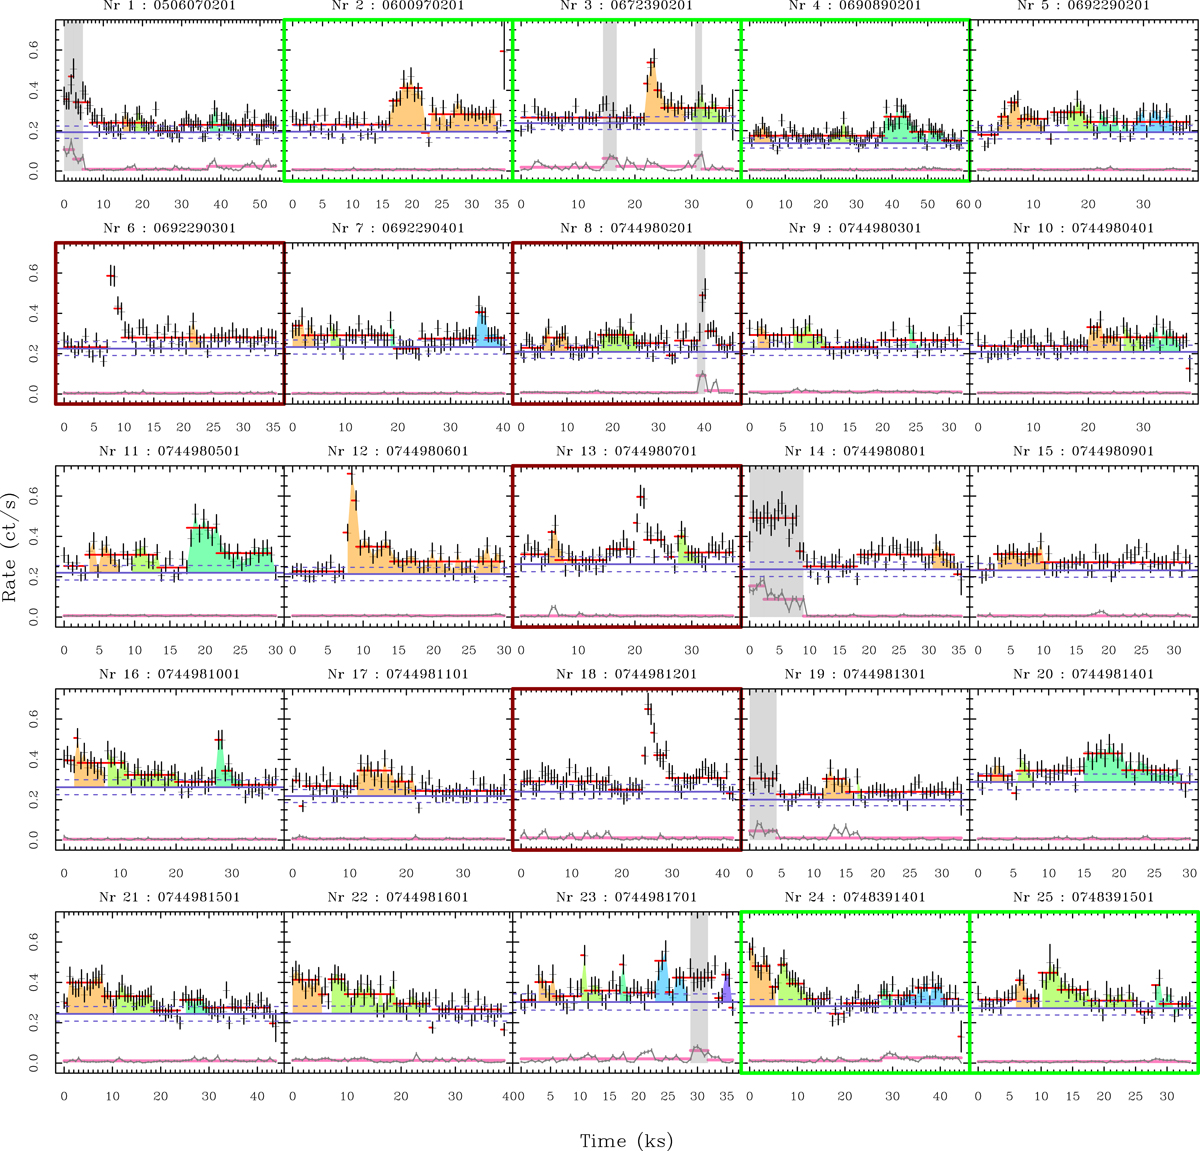
Fig. B.2.
Download original image
Light curves of HD 189733 A obtained with pn in the band 0.3−2.0 keV. The points with error bars are the net count rates of HD 189733 A for the events in the selection operated at points i and ii of Sect. 2. The horizontal red segments mark the intervals identified with the Changepoint algorithm. Similarly, the light red segments represent the intervals of constant background. In intervals of high background variability (gray shaded areas), we did not search for flares in HD 189733 A. The flares are shaded with different colors in each panel. The horizontal solid blue lines represent the quiescent rates and the ±1sigma range. Panels contoured with a green border refers to observations at the secondary transits. Panels marked with a red border indicate where variability of HD 189733 B was prominent.
Current usage metrics show cumulative count of Article Views (full-text article views including HTML views, PDF and ePub downloads, according to the available data) and Abstracts Views on Vision4Press platform.
Data correspond to usage on the plateform after 2015. The current usage metrics is available 48-96 hours after online publication and is updated daily on week days.
Initial download of the metrics may take a while.