Fig. 5.
Download original image
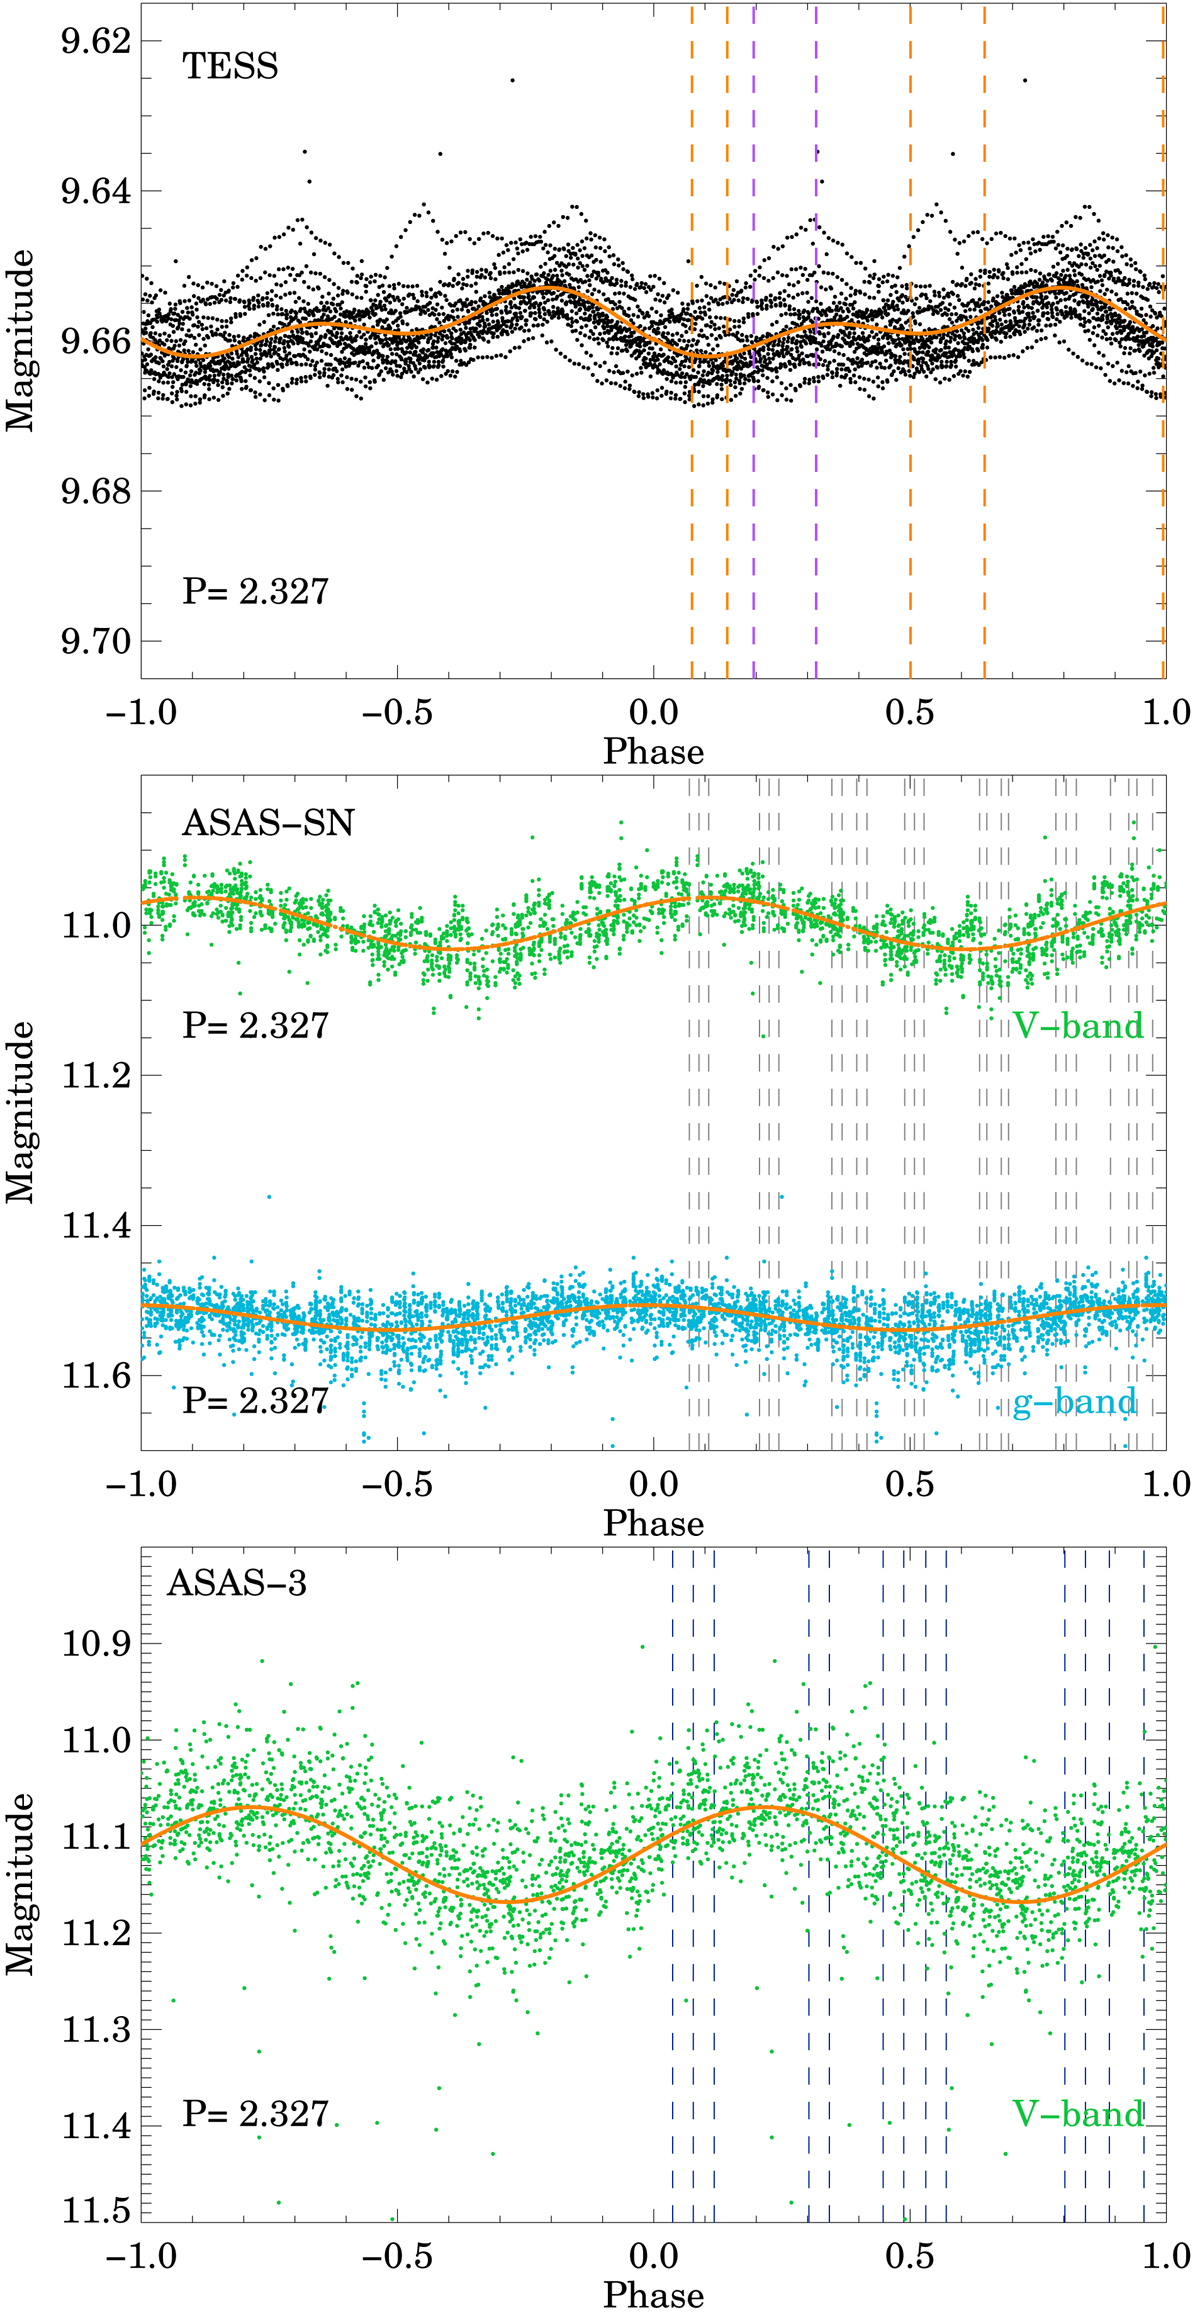
Phase-folded light curves of CR Cha. Vertical dashed lines indicate the epochs of the spectroscopic observations. Top panel: TESS measurements with the ESPRESSO (orange lines) and FEROS (purple lines) epochs, middle panel: ASAS-SN observations with the HARPS epochs (gray lines), and bottom panel: ASAS-3 data with the AAT epochs (dark blue lines). The orange curve shows the fitted sine curves to each data set.
Current usage metrics show cumulative count of Article Views (full-text article views including HTML views, PDF and ePub downloads, according to the available data) and Abstracts Views on Vision4Press platform.
Data correspond to usage on the plateform after 2015. The current usage metrics is available 48-96 hours after online publication and is updated daily on week days.
Initial download of the metrics may take a while.