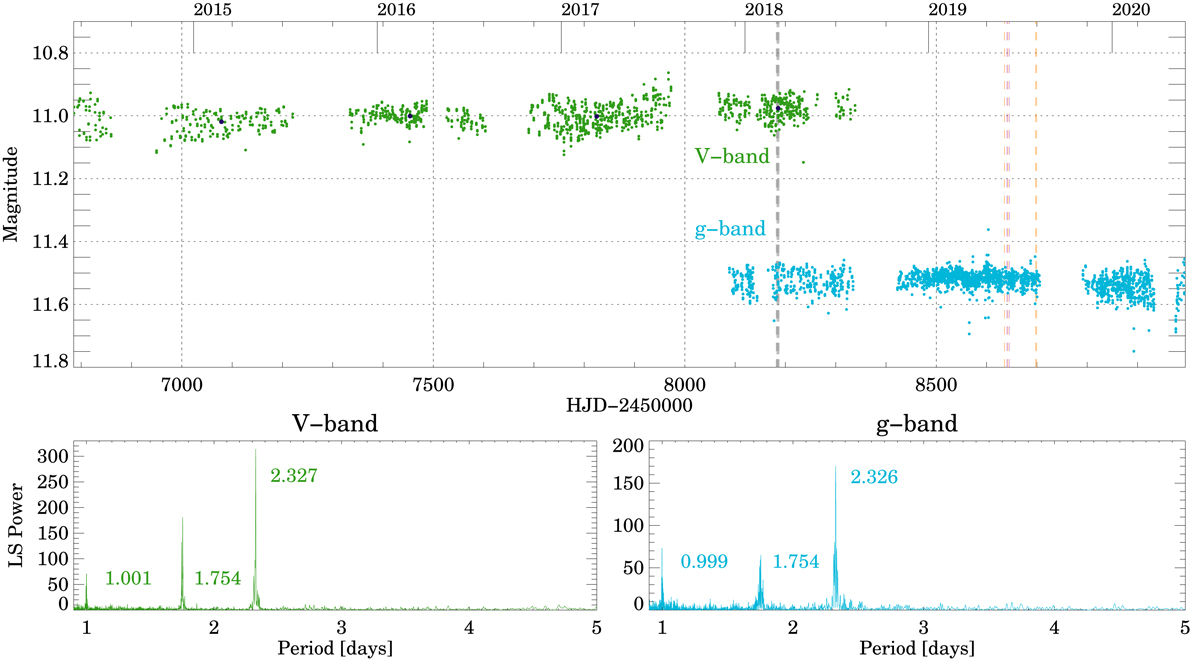
Fig. 3.
Download original image
ASAS-SN V- and g-band light curves are shown in the top panel along with epochs when the HARPS (dashed gray lines), the ESPRESSO (dashed orange lines) and the FEROS (dashed purple lines) were taken. The black dots indicate the median brightness for each group of data. Bottom left panel: Lomb-Scargle periodogram for the V-band data, and right panel: Lomb-Scargle periodogram for the g-band data.
Current usage metrics show cumulative count of Article Views (full-text article views including HTML views, PDF and ePub downloads, according to the available data) and Abstracts Views on Vision4Press platform.
Data correspond to usage on the plateform after 2015. The current usage metrics is available 48-96 hours after online publication and is updated daily on week days.
Initial download of the metrics may take a while.