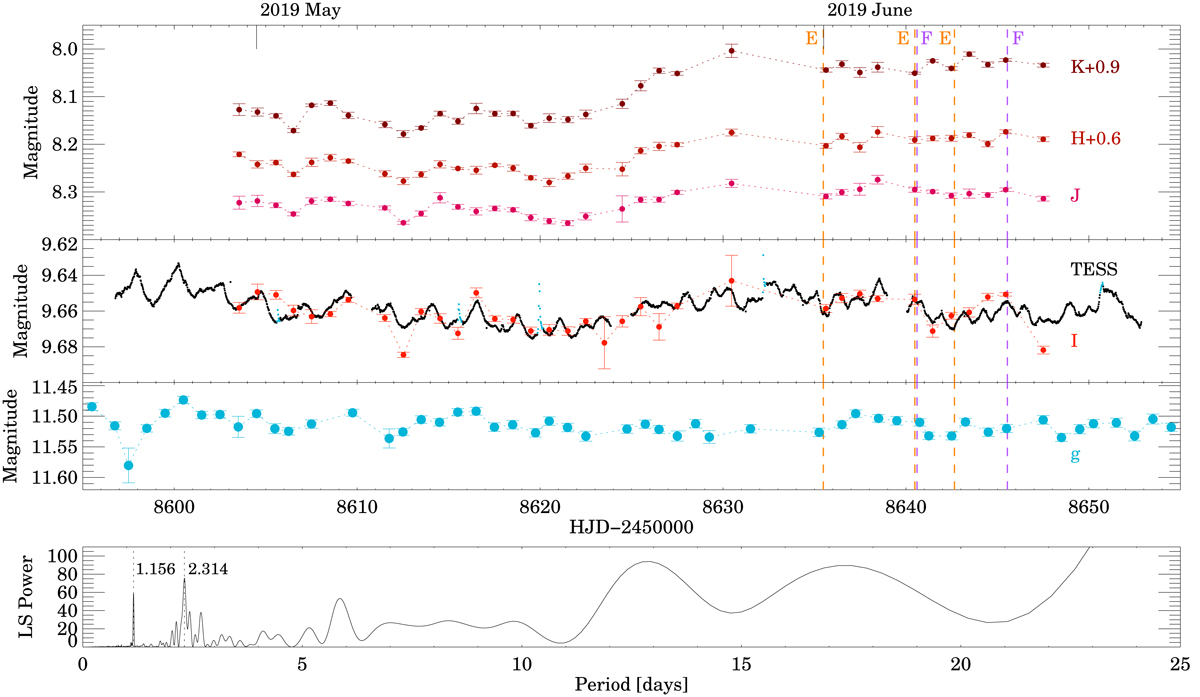
Fig. 1.
Download original image
TESS light curve, indicated with a black curve. The flare-like events are colored in blue. The ground-based IJHK-band measurements are shown with colored dots and were shifted along the y-axis by the values indicated in the corresponding labels in the figure. The nightly averaged ASAS-SN g-band observations obtained during the TESS observing period are plotted with blue points. The vertical dashed orange and purple lines show the epochs when the ESPRESSO (E) and FEROS (F) spectra were taken, respectively. The long tickmarks at the top of the figure indicate the beginning of each month. Bottom panel: Lomb-Scargle periodogram obtained using the TESS data.
Current usage metrics show cumulative count of Article Views (full-text article views including HTML views, PDF and ePub downloads, according to the available data) and Abstracts Views on Vision4Press platform.
Data correspond to usage on the plateform after 2015. The current usage metrics is available 48-96 hours after online publication and is updated daily on week days.
Initial download of the metrics may take a while.