Fig. 9
Download original image
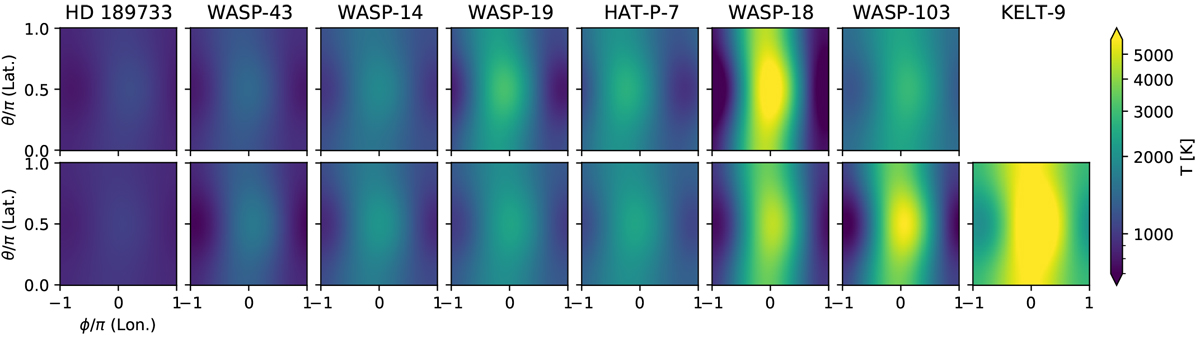
Maximum-likelihood temperature maps for several of the hottest exoplanets, in order of increasing equilibrium temperature from left to right, where the horizontal axes are planetary longitude and vertical axes are latitude. The horizontal axis is the longitude centered on the sub stellar point, the vertical axis is latitude from pole to pole. The upper row shows the Spitzer IRAC Channel 1 (3.6 μm) inferences, the lower row shows IRAC Channel 2 (4.5 μm). The longitudinal temperature variations are constrained by the Spitzer phase curve observations while the latitudinal temperature variations are fixed at the parameterization that best describes the GCMs.
Current usage metrics show cumulative count of Article Views (full-text article views including HTML views, PDF and ePub downloads, according to the available data) and Abstracts Views on Vision4Press platform.
Data correspond to usage on the plateform after 2015. The current usage metrics is available 48-96 hours after online publication and is updated daily on week days.
Initial download of the metrics may take a while.