Fig. 8
Download original image
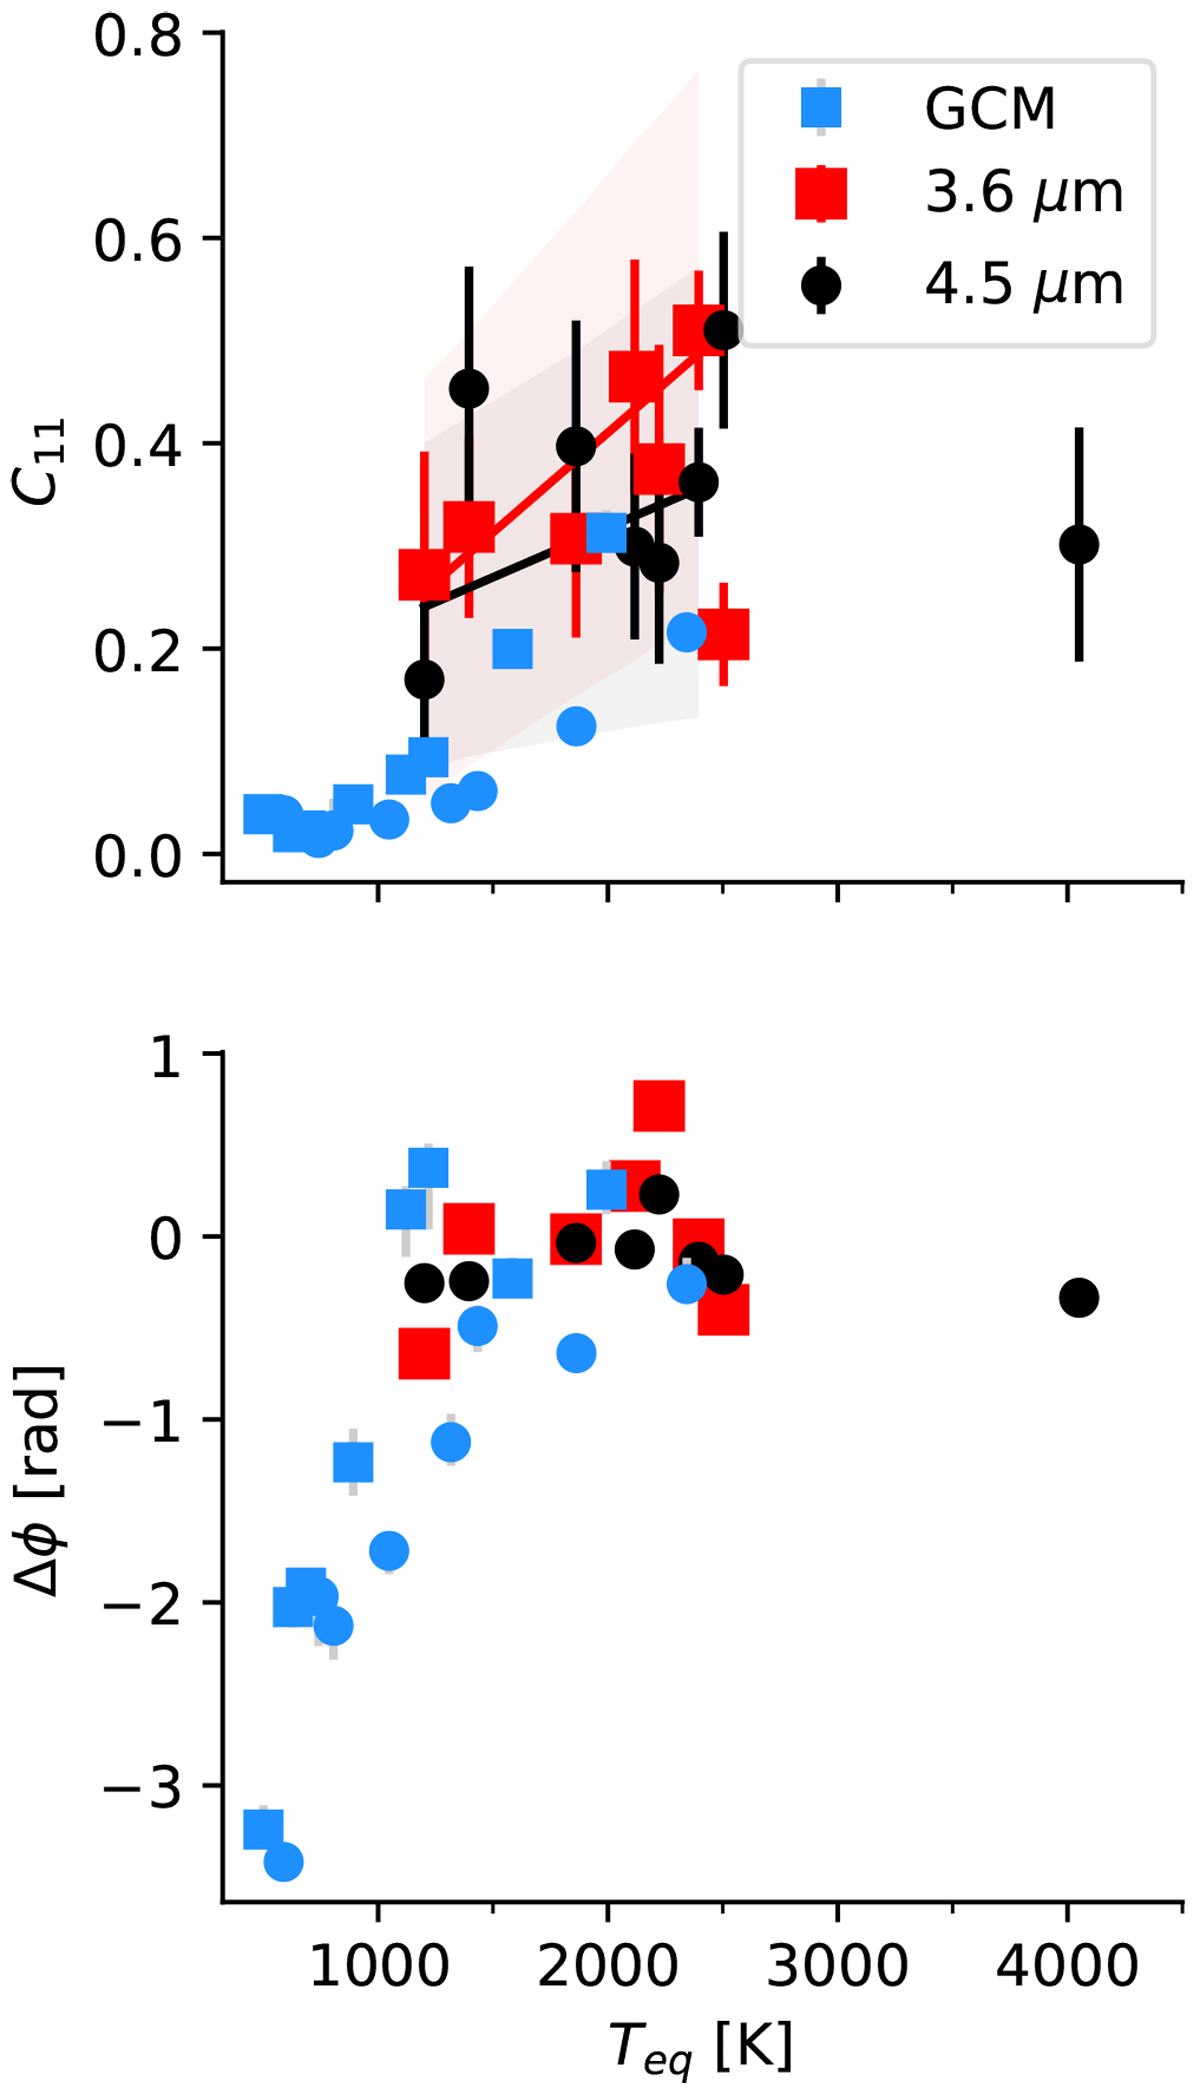
Maximum-likelihood parameters for the spherical harmonic power coefficient C11 (upper) and hotspot offset (lower) for the full sample of GCM fits and Spitzer phase curve fits in two filter bands. Blue points are the results of fits to GCMs, circles and squares correspond to inverted and non-inverted atmospheres. Red squares and black circles represent fits to the Spitzer phase curves in filters IRAC 1 and 2, respectively.
Current usage metrics show cumulative count of Article Views (full-text article views including HTML views, PDF and ePub downloads, according to the available data) and Abstracts Views on Vision4Press platform.
Data correspond to usage on the plateform after 2015. The current usage metrics is available 48-96 hours after online publication and is updated daily on week days.
Initial download of the metrics may take a while.