Fig. 5
Download original image
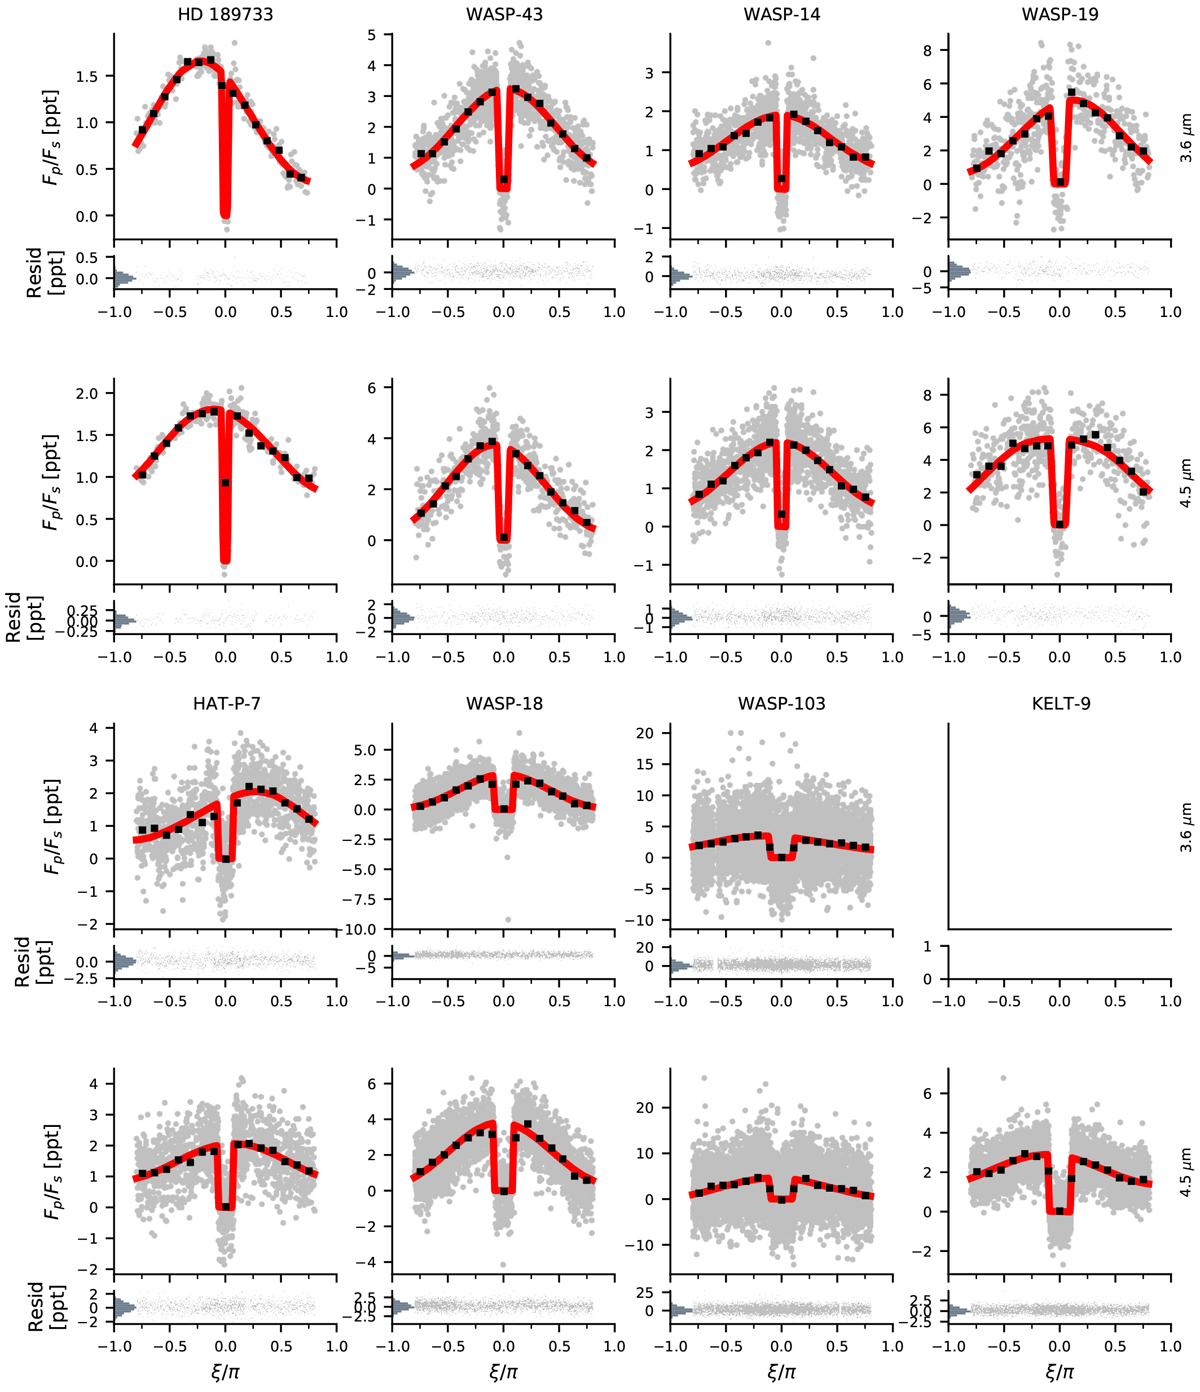
Spitzer phase curves of the eight exoplanets (gray, binned in black) fit with the hmℓ basis (red), plotted in order of equilibrium temperature (low to high from top left to bottom right). Each planet is plotted with the IRAC Channel 1 phase curve in the first and third row and the Channel 2 phase curve in the second and fourth row (see row labels on the right side). Maximum likelihood parameters for each fit are listed in Table 3. Residuals are plotted beneath each fit with a histogram of residuals on the left.
Current usage metrics show cumulative count of Article Views (full-text article views including HTML views, PDF and ePub downloads, according to the available data) and Abstracts Views on Vision4Press platform.
Data correspond to usage on the plateform after 2015. The current usage metrics is available 48-96 hours after online publication and is updated daily on week days.
Initial download of the metrics may take a while.