Free Access
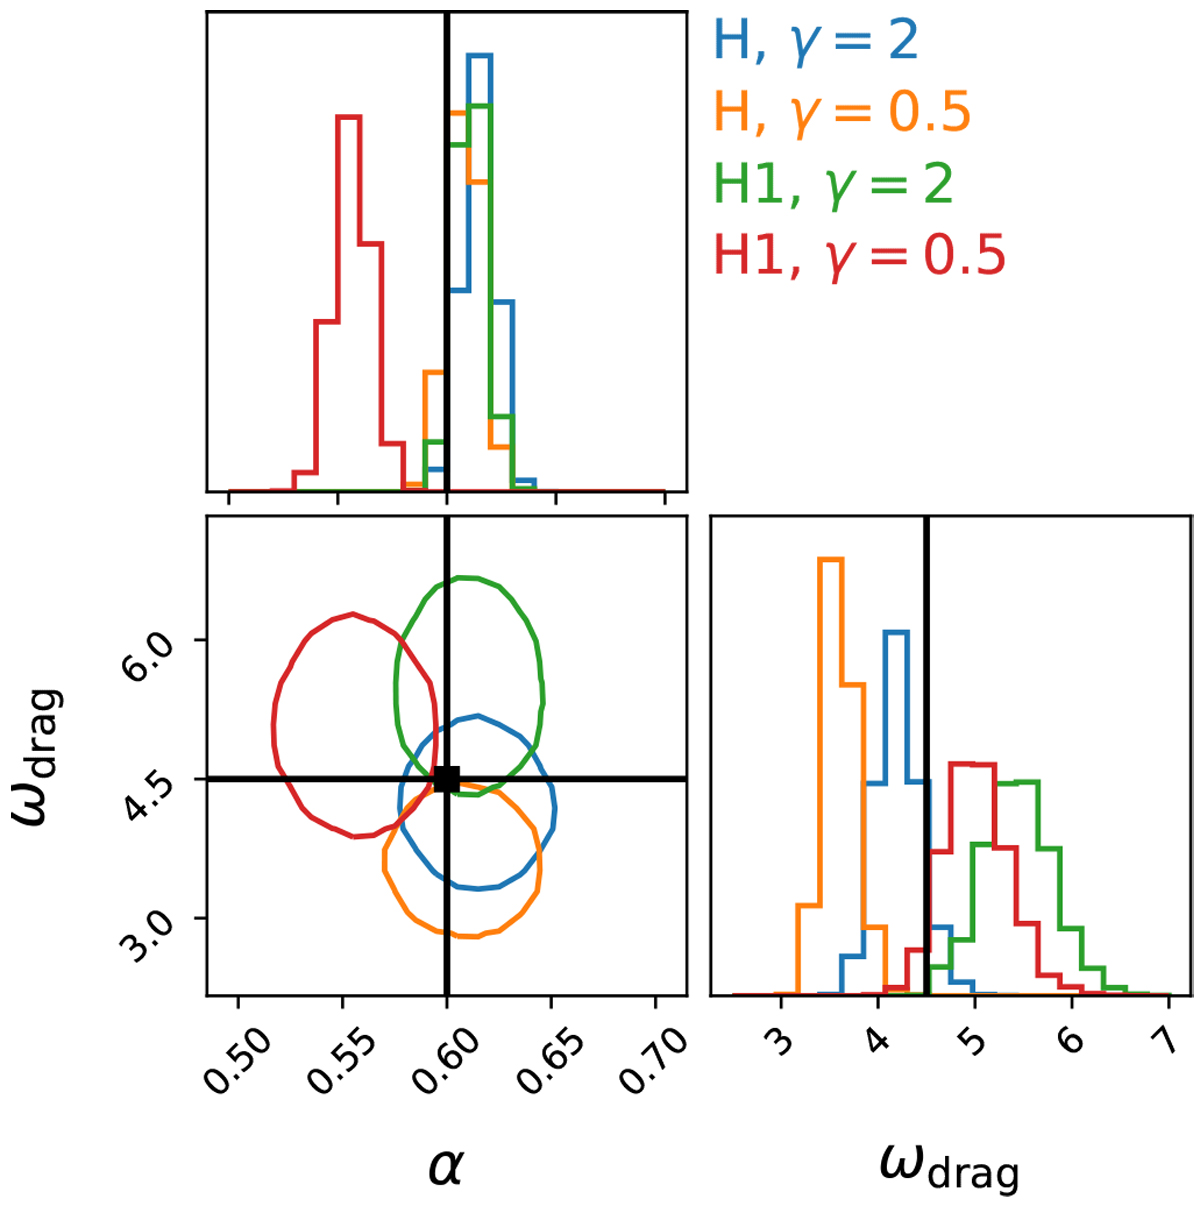
Fig. 4
Download original image
Posterior correlations between α and ωdrag from fits of the hmℓ basis maps with ℓmax= 1 to the four hottest GCM temperature maps. The posterior distributions overlap at a few standard deviations for the values we adopt in the remainder of this work, α = 0.6 and ωdrag = 4.5 (marked with black lines).
Current usage metrics show cumulative count of Article Views (full-text article views including HTML views, PDF and ePub downloads, according to the available data) and Abstracts Views on Vision4Press platform.
Data correspond to usage on the plateform after 2015. The current usage metrics is available 48-96 hours after online publication and is updated daily on week days.
Initial download of the metrics may take a while.