Fig. 3
Download original image
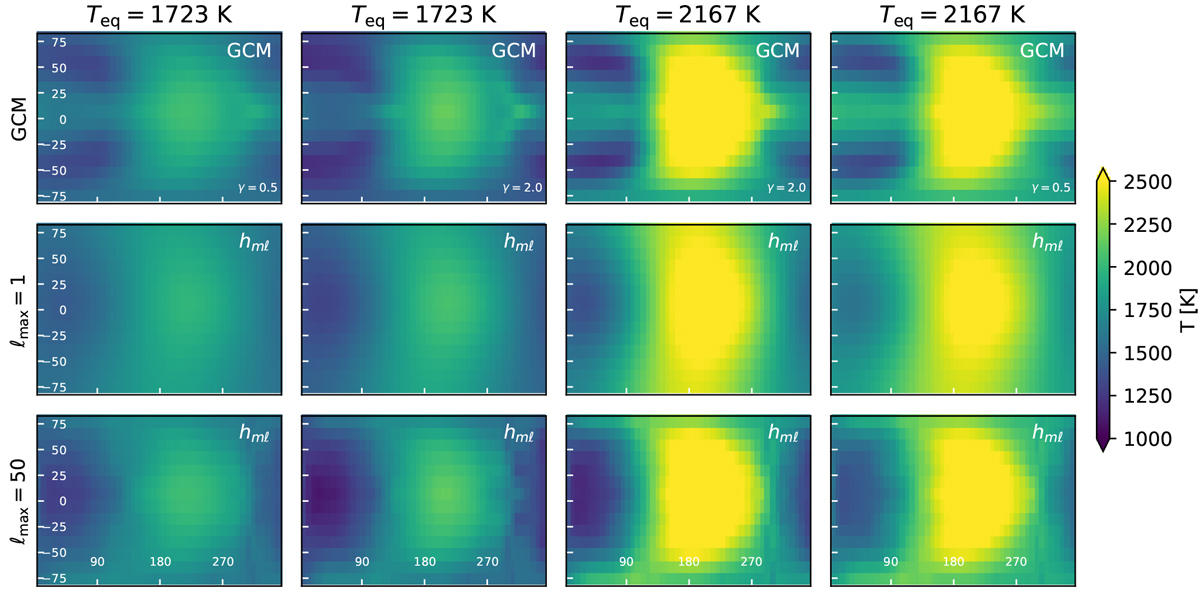
Comparison between the 2D temperature maps of hot Jupiter GCMs in the upper row (Perna et al. 2012), and the 2D temperature maps represented with the hmℓ basis in the middle and lower rows with ℓmax = 1 and 50, respectively. The horizontal axis is longitude, the vertical axis is latitude, and the center of each map is the substellar point. For model input parameters see Table 1; for an outline of the linear algorithm used to fit maps with ℓmax = 50, see Appendix A.
Current usage metrics show cumulative count of Article Views (full-text article views including HTML views, PDF and ePub downloads, according to the available data) and Abstracts Views on Vision4Press platform.
Data correspond to usage on the plateform after 2015. The current usage metrics is available 48-96 hours after online publication and is updated daily on week days.
Initial download of the metrics may take a while.