Fig. C.1
Download original image
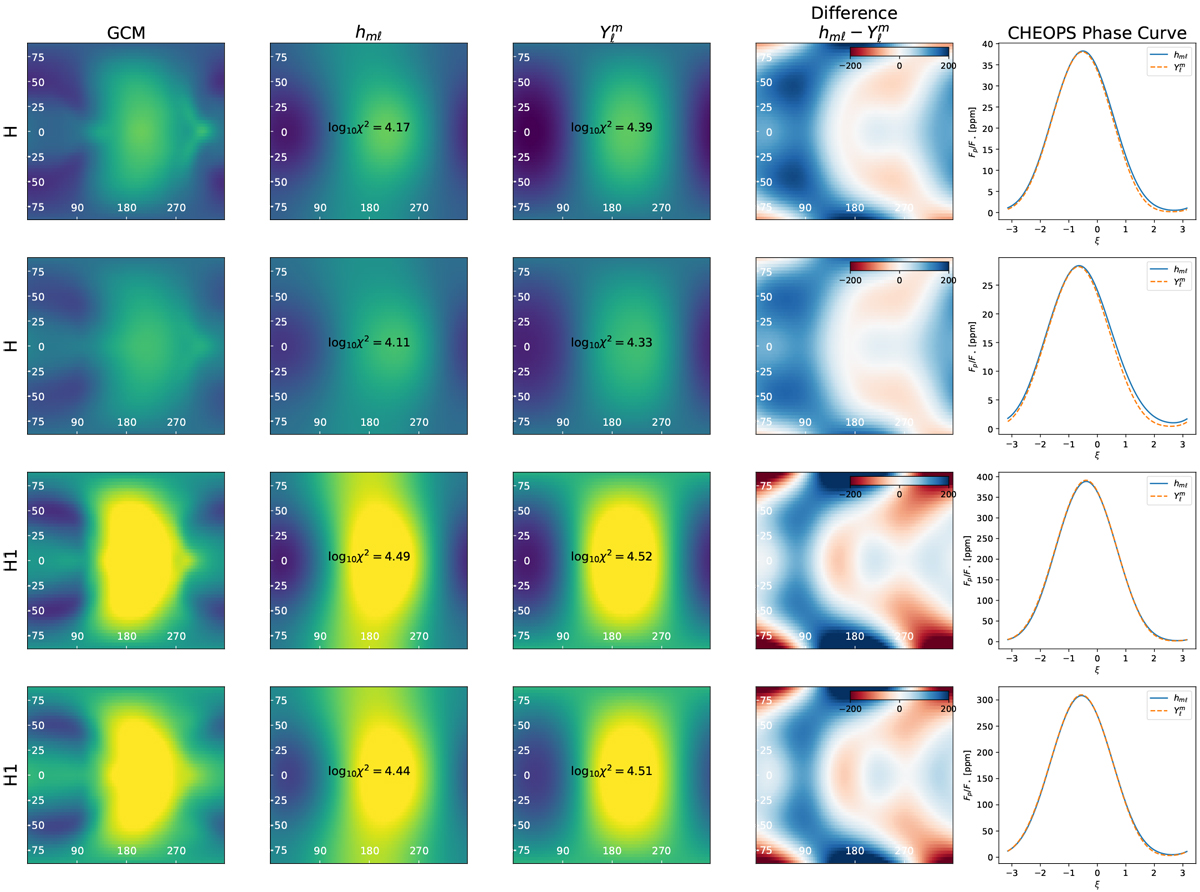
The four hottest GCM temperature maps (first column), the best-fit linear solutions with a low-order hmℓ representation (second column), the fits with low-order ordinary spherical harmonic representation (third column, labeled ![]() ), the difference between the two representations (fourth column), and the phase curves produced by the two representations of the GCM map as observed in the CHEOPS bandpass (fifth column).
), the difference between the two representations (fourth column), and the phase curves produced by the two representations of the GCM map as observed in the CHEOPS bandpass (fifth column).
Current usage metrics show cumulative count of Article Views (full-text article views including HTML views, PDF and ePub downloads, according to the available data) and Abstracts Views on Vision4Press platform.
Data correspond to usage on the plateform after 2015. The current usage metrics is available 48-96 hours after online publication and is updated daily on week days.
Initial download of the metrics may take a while.