Fig. 10
Download original image
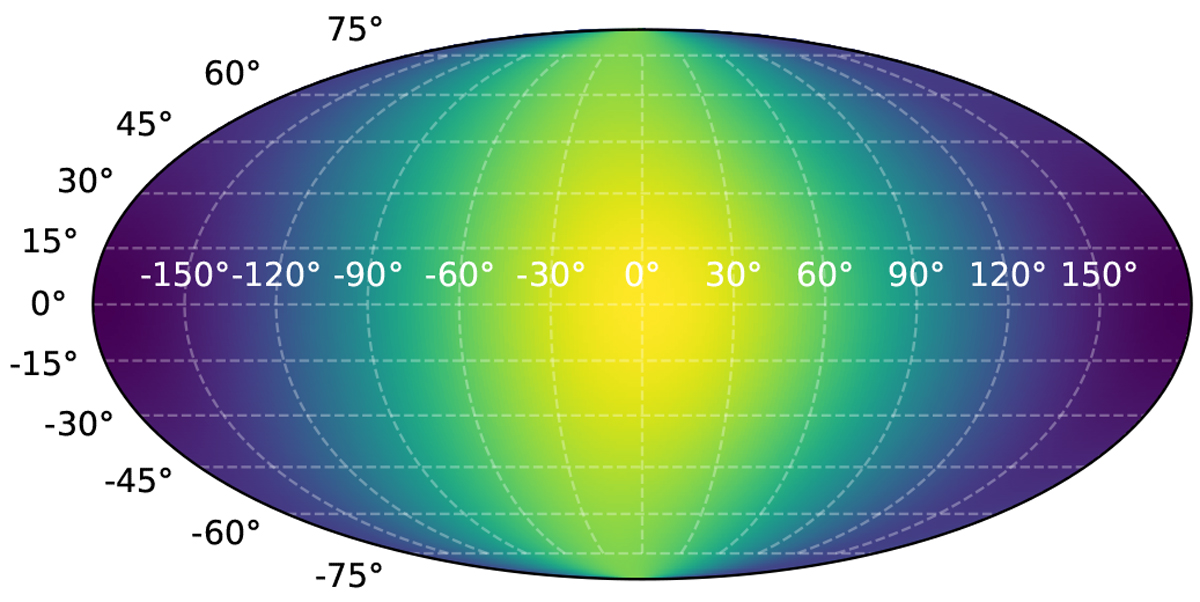
The “universal” temperature map for hot Jupiters: scaled versions of this temperature map are consistent with both the temperature distributions in GCMs (which constrain the latitudinal distribution) and the phase curves of the hottest exoplanets (which constrain the longitudinal distribution). This map has α = 0.6 and ωdrag = 4.5 and an arbitrary scaling for ƒ, C11 and Δϕ = 0.
Current usage metrics show cumulative count of Article Views (full-text article views including HTML views, PDF and ePub downloads, according to the available data) and Abstracts Views on Vision4Press platform.
Data correspond to usage on the plateform after 2015. The current usage metrics is available 48-96 hours after online publication and is updated daily on week days.
Initial download of the metrics may take a while.