Fig. 1
Download original image
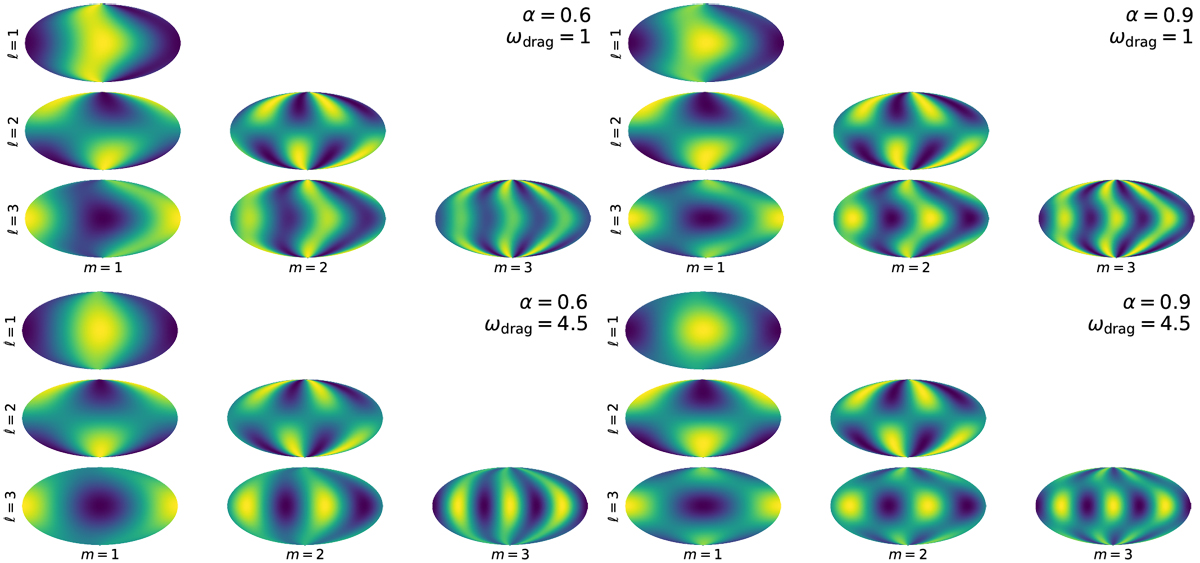
Four montages of the first several terms in the generalized spherical harmonic expansion of the temperature map in the hmℓ basis. Each montage corresponds to a different combination of α and ωdrag, labeled in the upper right of each quadrant. Each map shows the temperature perturbation (purple to yellow is cold to hot) as a function of latitude and longitude (shown in Moll weide projections such that the sub stellar longitude is in the center of the plot). The m = 0 terms are always zero. The even-ℓ terms are asymmetric about the equator and therefore do not represent typical GCM results in equilibrium, so we keep all even-ℓ power coefficients fixed to zero in the subsequent fits (this approach assumes edge-on orbits, for exceptions see Cowan et al. 2017). In the upper two quadrants, when ωdrag is set to a smaller value, the chevron shape becomes more pronounced. In the two quadrants on the right, when the α is set to a larger value, the concentration of heat near the equator is more pronounced.
Current usage metrics show cumulative count of Article Views (full-text article views including HTML views, PDF and ePub downloads, according to the available data) and Abstracts Views on Vision4Press platform.
Data correspond to usage on the plateform after 2015. The current usage metrics is available 48-96 hours after online publication and is updated daily on week days.
Initial download of the metrics may take a while.