Fig. 6
Download original image
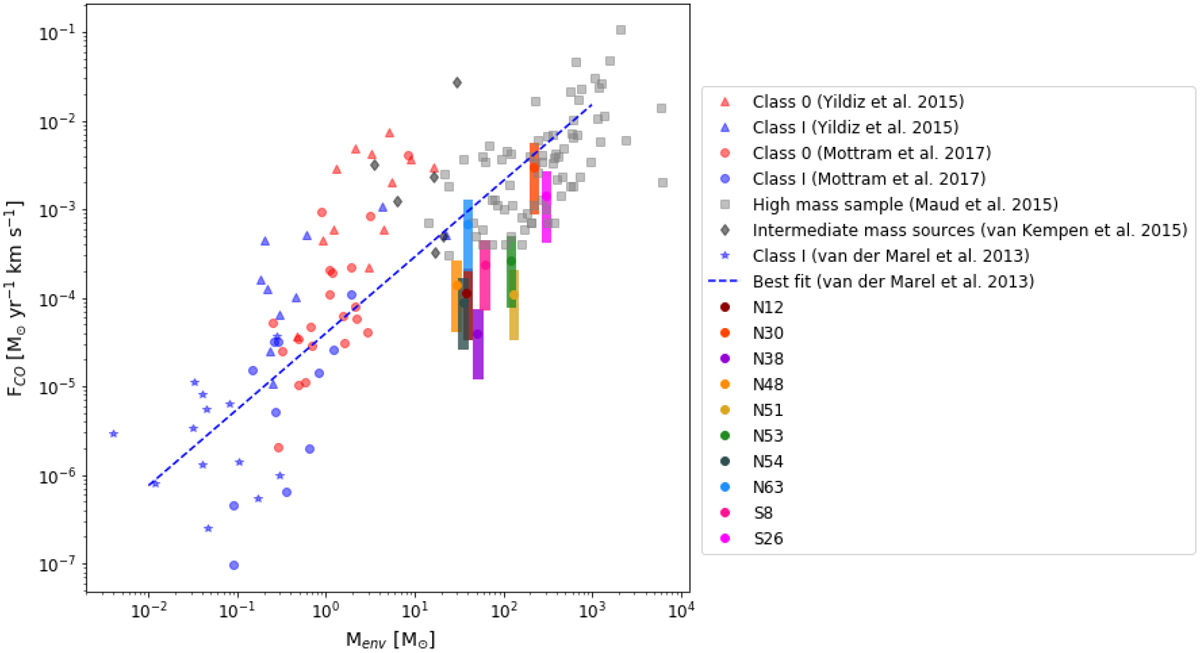
Outflow forces for the ten sources of the PILS Cygnus survey over their envelope mass. The outflow forces are plotted using colored rectangles covering the range of possible results for the different inclination correction factors. Plotted in the same figure are, Class 0 sources from Yildiz et al. (2015) in red triangles, Class I sources from Yildiz et al. (2015) in blue triangles, Class 0 sources from Mottram et al. (2017) in red circles, Class I sources from Mottram et al. (2017) in blue circles, Class I sources from van der Marel et al. (2013) in blue stars, intermediate-mass sources from van Kempen et al. (2009) in dark gray diamonds and high mass sources from Maud et al. (2015b) in light gray squares. The blue dashed line shows the best fit as found in van der Marel et al. (2013) for CO J = 3–2 observations of a low mass protostellar sample.
Current usage metrics show cumulative count of Article Views (full-text article views including HTML views, PDF and ePub downloads, according to the available data) and Abstracts Views on Vision4Press platform.
Data correspond to usage on the plateform after 2015. The current usage metrics is available 48-96 hours after online publication and is updated daily on week days.
Initial download of the metrics may take a while.