Fig. 5
Download original image
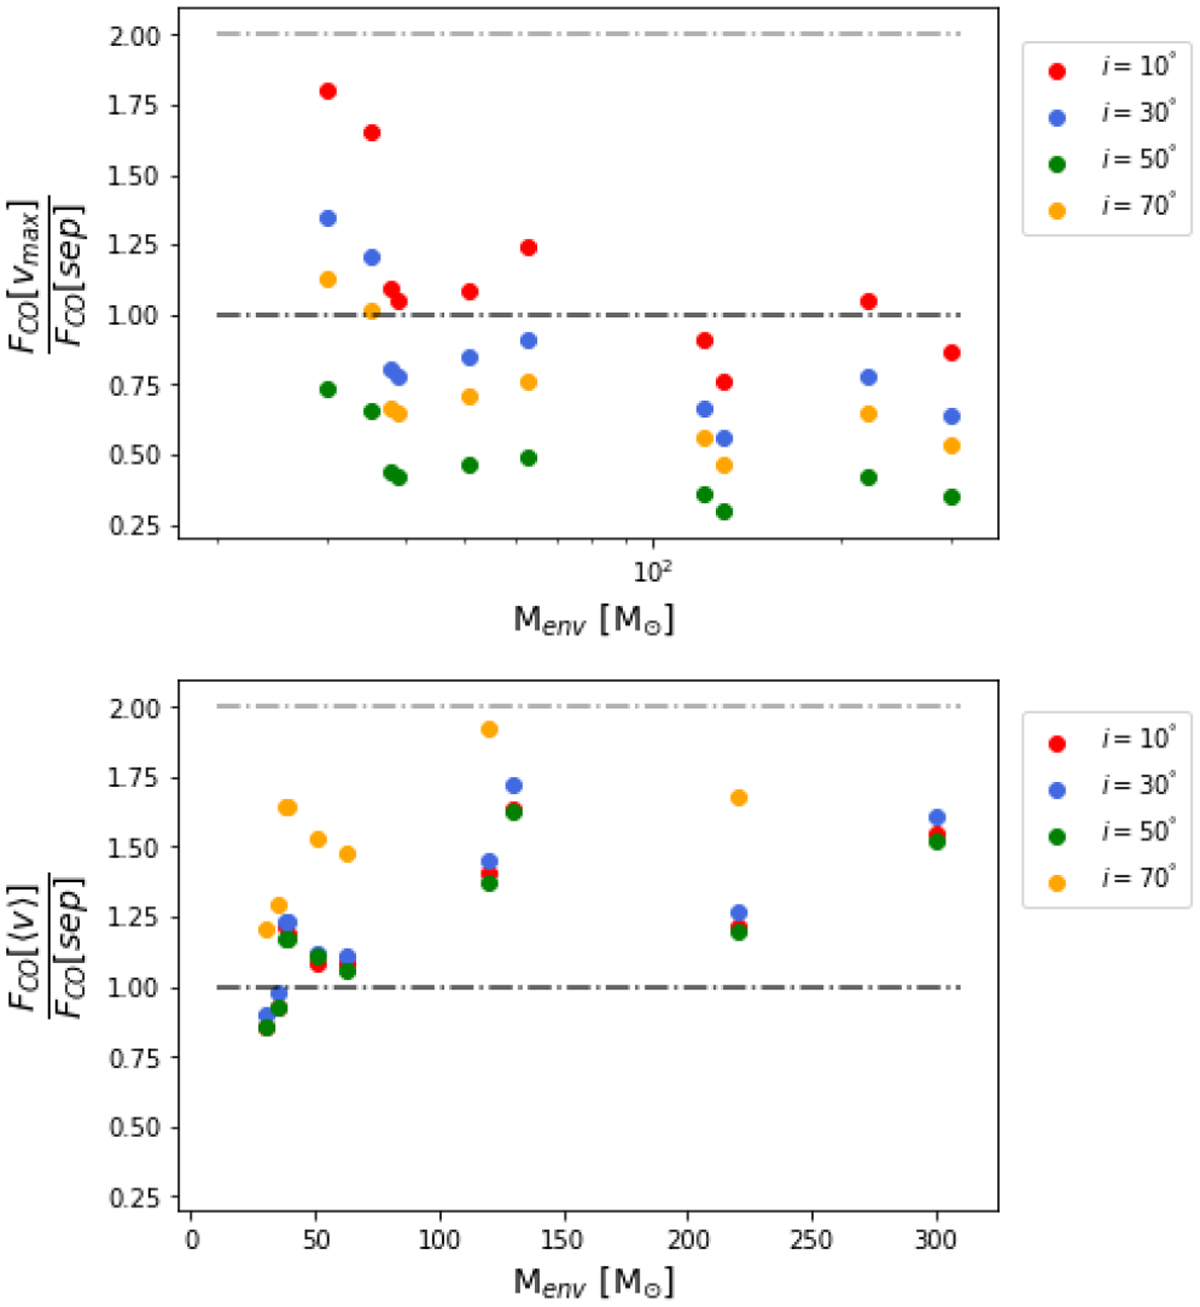
Comparison of different outflow force calculation methods. Top: ratio of the outflow forces for the 10 sources of the PILS-Cygnus survey, as measured using the υmax over the separation method. Bottom: ratio of the outflow forces for the 10 sources of the PILS-Cygnus survey, as measured using the 〈υ〉 over the separation method. In both cases, red points mark the results for i = 10°, blue for i = 30°, green for i = 50° and orange for i = 70°. Also plotted in black and gray dotted lines are the 1:1 and 2:1 ratios respectively.
Current usage metrics show cumulative count of Article Views (full-text article views including HTML views, PDF and ePub downloads, according to the available data) and Abstracts Views on Vision4Press platform.
Data correspond to usage on the plateform after 2015. The current usage metrics is available 48-96 hours after online publication and is updated daily on week days.
Initial download of the metrics may take a while.