Fig. 1
Download original image
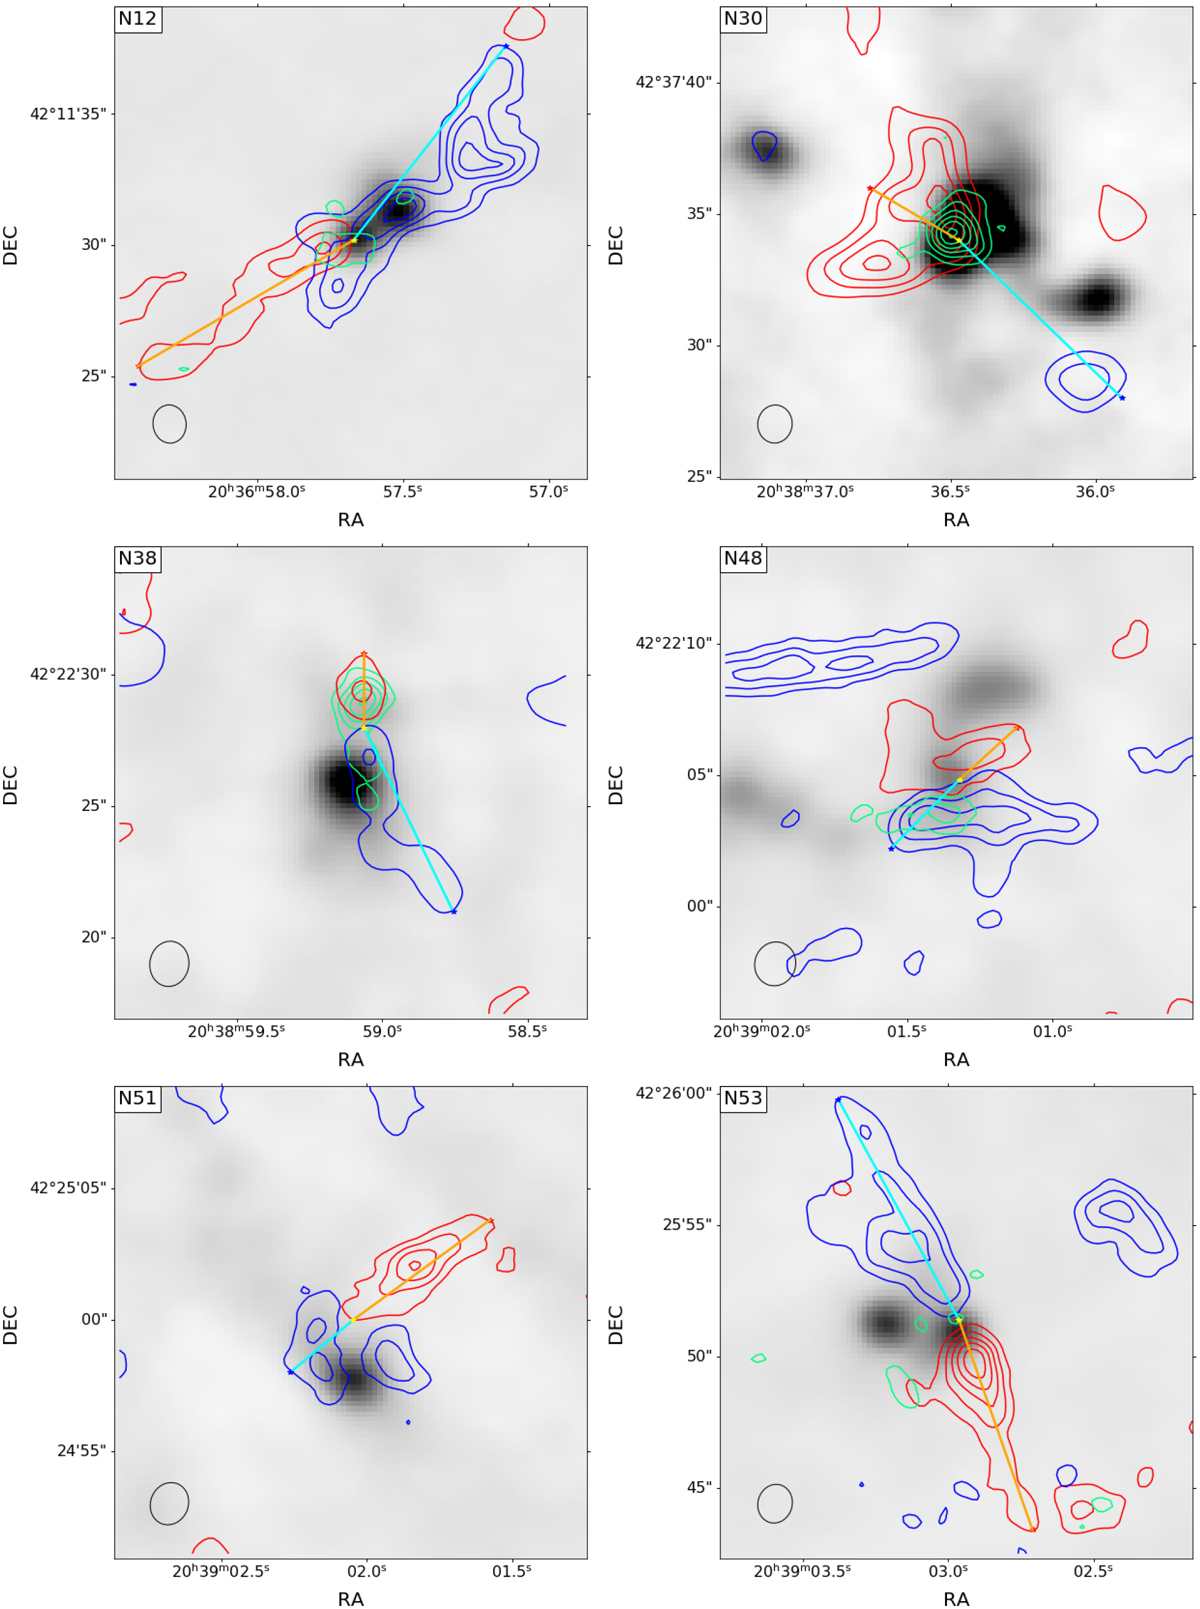
Continuum emission of the sources of the PILS-Cygnus survey (Pitts et al. 2022) plotted in gray-scale ranging from −0.1 to 0.5 Jy beam−1 in all maps. Displayed in red contours is the red-shifted CO emission, in blue contours is the blue-shifted CO emission, and in green contours is the integrated SiO emission, when detected. All contour levels are set at 3, 6, 9, 12, 15σrms noise of the corresponding integrated emission. The yellow star marks the assumed origin of the outflow and the light blue and orange lines mark the extend of the outflow lobes. Finally, the beam is marked with the black contour at the bottom left.
Current usage metrics show cumulative count of Article Views (full-text article views including HTML views, PDF and ePub downloads, according to the available data) and Abstracts Views on Vision4Press platform.
Data correspond to usage on the plateform after 2015. The current usage metrics is available 48-96 hours after online publication and is updated daily on week days.
Initial download of the metrics may take a while.