Fig. 5.
Download original image
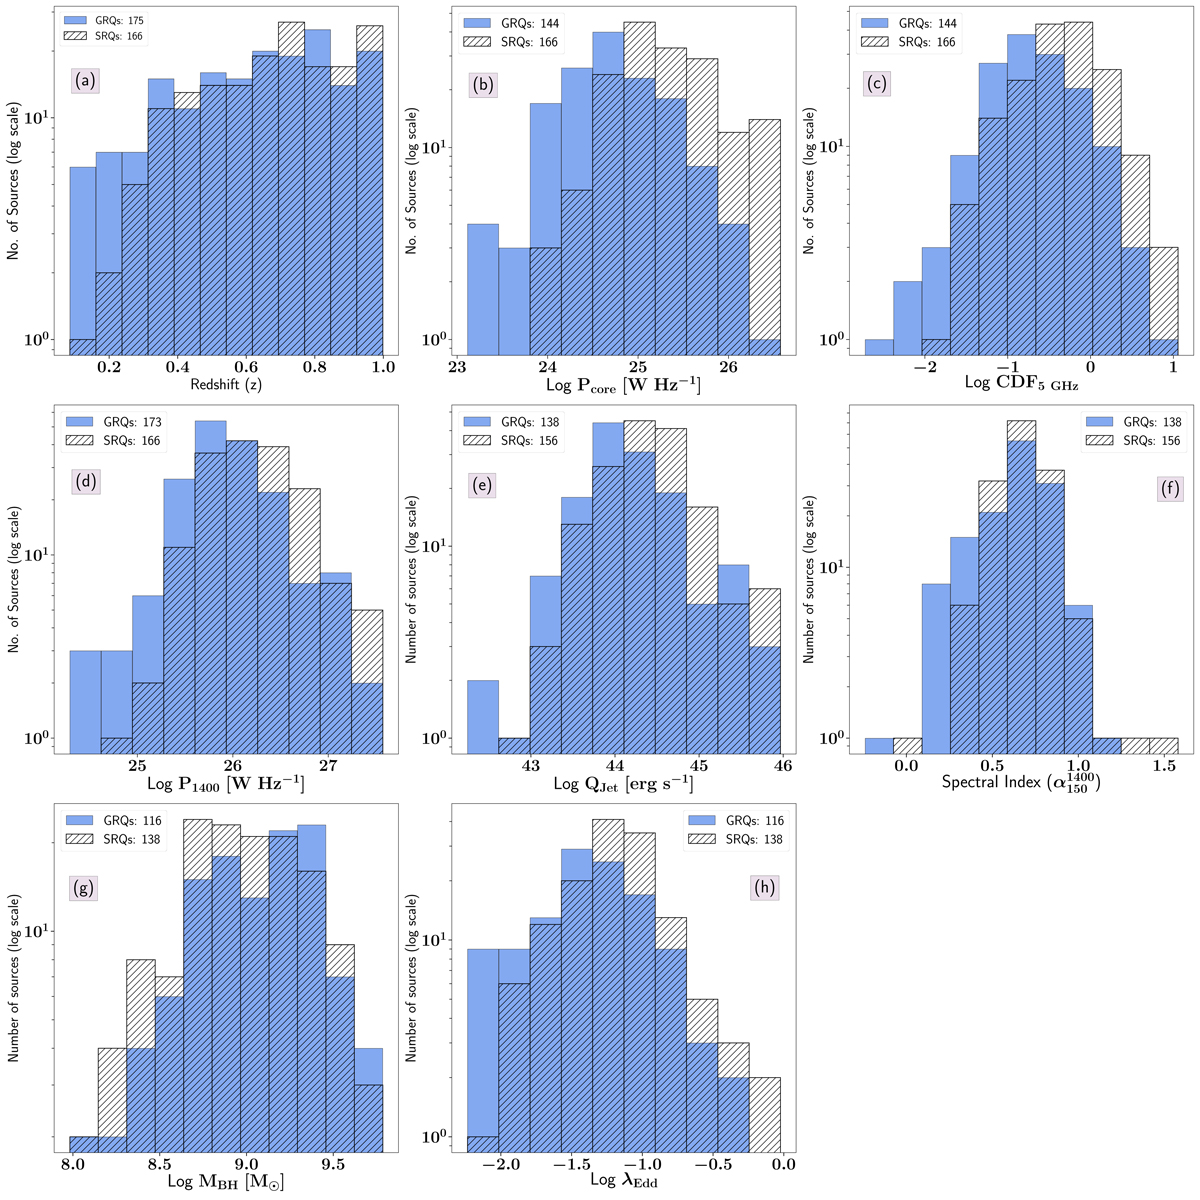
Properties of the redshift-matched samples (z ≤ 1.00), where GRQs and SRQs are represented in unhatched and hatched bins, respectively. The mean and median values of the distributions are given in Table 2. Panel a: redshift distributions for z ≤ 1.00; Panel b: distributions of radio core power (Pcore) at 1400 MHz obtained from the FIRST; Panel c: distributions of the CDF; Panel d: distributions of total radio power (P1400) at 1400 MHz obtained from the NVSS; Panel e: distributions of jet kinetic power (QJet); Panel f: distributions of spectral index (![]() ) estimated using flux densities at 150 MHz and 1400 MHz; Panel g: distributions of black hole mass (MBH); and Panel h: distributions of the Eddington ratio (λEdd) of GRQs and SRQs.
) estimated using flux densities at 150 MHz and 1400 MHz; Panel g: distributions of black hole mass (MBH); and Panel h: distributions of the Eddington ratio (λEdd) of GRQs and SRQs.
Current usage metrics show cumulative count of Article Views (full-text article views including HTML views, PDF and ePub downloads, according to the available data) and Abstracts Views on Vision4Press platform.
Data correspond to usage on the plateform after 2015. The current usage metrics is available 48-96 hours after online publication and is updated daily on week days.
Initial download of the metrics may take a while.