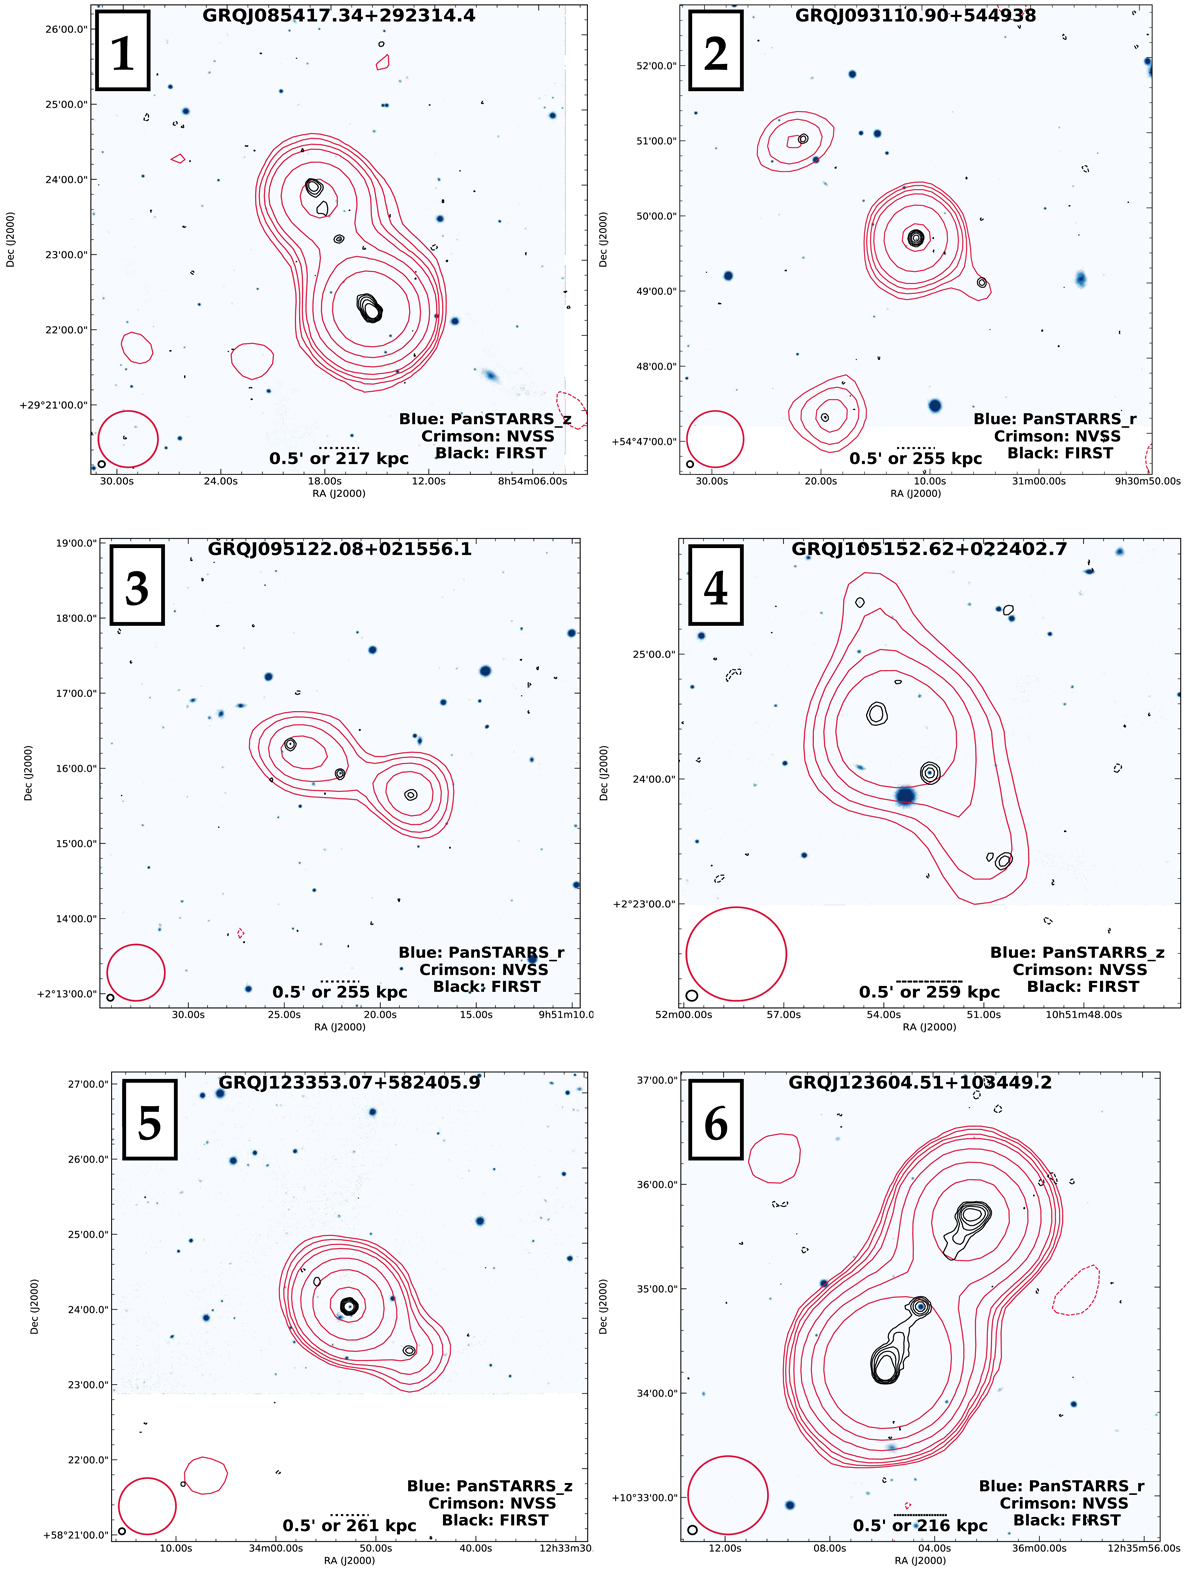
Fig. 3.
Download original image
Radio maps of the ten new GRQs (this page has numbers 1 to 6) as described in Sect. 2.1. The crimson contour represents the radio emission detected in the NVSS and black contours that from the FIRST survey. The background (blue) colour images are from the Pan-STARRS r band. In the lower-left corner, the beams of the NVSS and the FIRST are shown. The bottom middle of each image shows the angular scale for reference. The numbers in the upper-left corner represent the serial numbers from Table 1. Contour levels are at 3σ × [ − 1, 1, 1.4, 2.0, 2.8, 5.6, 11.2, 22.4] for the NVSS and 3σ × [ − 1, 1.4, 2.0, 2.8, 5.6, 11.2, 22.4] for the FIRST, where dashed contours represent negative values. The typical σ values for the FIRST and the NVSS are 0.15 and 0.45 mJy beam−1, respectively.
Current usage metrics show cumulative count of Article Views (full-text article views including HTML views, PDF and ePub downloads, according to the available data) and Abstracts Views on Vision4Press platform.
Data correspond to usage on the plateform after 2015. The current usage metrics is available 48-96 hours after online publication and is updated daily on week days.
Initial download of the metrics may take a while.