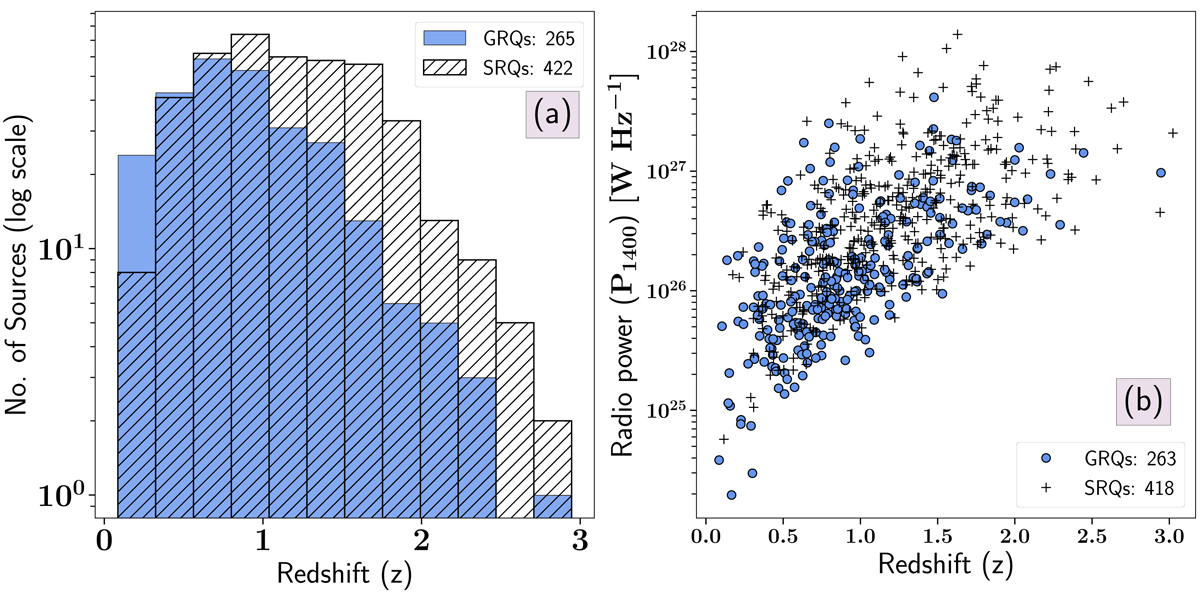
Fig. 2.
Download original image
Redshift distributions and relation with radio power. Left (a): redshift (z) distributions of all GRQs and SRQs. Right (b): all the GRQs and SRQs plotted on the P − z plane. The blue circles represent the GRQs and the plus signs the SRQs. The 1400 MHz NVSS flux density measurements were not available for two GRQs due to their position beyond the coverage area of the NVSS. For four SRQs, the flux densities at 1400 MHz are contaminated by the presence of other sources due to the low resolution of the NVSS. Therefore, (b) has 418 out of the 422 SRQs, and 263 out of the 265 GRQs.
Current usage metrics show cumulative count of Article Views (full-text article views including HTML views, PDF and ePub downloads, according to the available data) and Abstracts Views on Vision4Press platform.
Data correspond to usage on the plateform after 2015. The current usage metrics is available 48-96 hours after online publication and is updated daily on week days.
Initial download of the metrics may take a while.