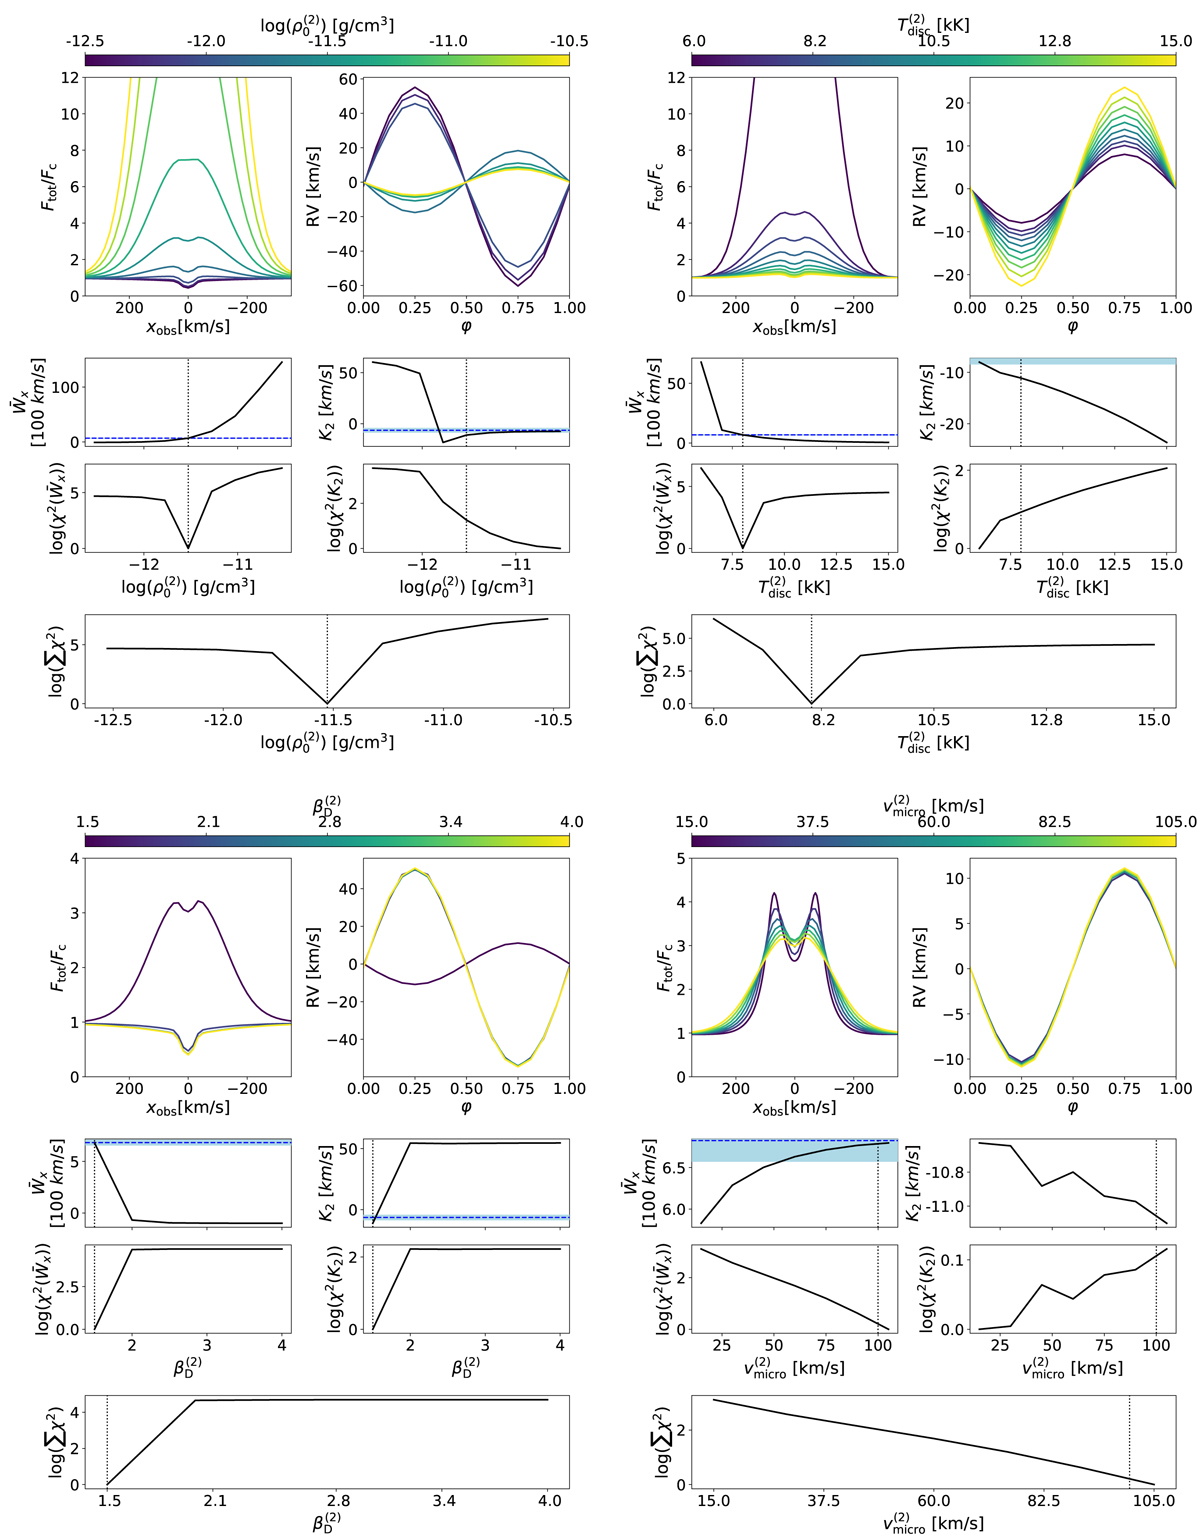
Fig. C.1.
Download original image
Parameter study with base parameters defined in Table 3 for model PB_SBH. Upper left main-panel: Synthetic line profiles at phase φ = 0 (top left sub-panel), radial-velocity curve (top right sub-panel), equivalent width with corresponding reduced χ2-value (middle left sub-panels), semi-amplitude of the radial velocity curve with corresponding reduced χ2-value (middle right sub-panels), and total reduced χ2-value (bottom panel), all as a function of the disc’s base density, ![]() . The black dotted line indicates our best-fit by eye (see Sect. 4.1), and the blue dashed lines display the observed values with corresponding error-bars (blue-shaded area). Similarly, the top right to bottom right main-panels indicate the dependence of our measurable quantities on the disc’s temperature,
. The black dotted line indicates our best-fit by eye (see Sect. 4.1), and the blue dashed lines display the observed values with corresponding error-bars (blue-shaded area). Similarly, the top right to bottom right main-panels indicate the dependence of our measurable quantities on the disc’s temperature, ![]() , the slope of the density stratification,
, the slope of the density stratification, ![]() , and the micro-turbulent velocity,
, and the micro-turbulent velocity, ![]() .
.
Current usage metrics show cumulative count of Article Views (full-text article views including HTML views, PDF and ePub downloads, according to the available data) and Abstracts Views on Vision4Press platform.
Data correspond to usage on the plateform after 2015. The current usage metrics is available 48-96 hours after online publication and is updated daily on week days.
Initial download of the metrics may take a while.