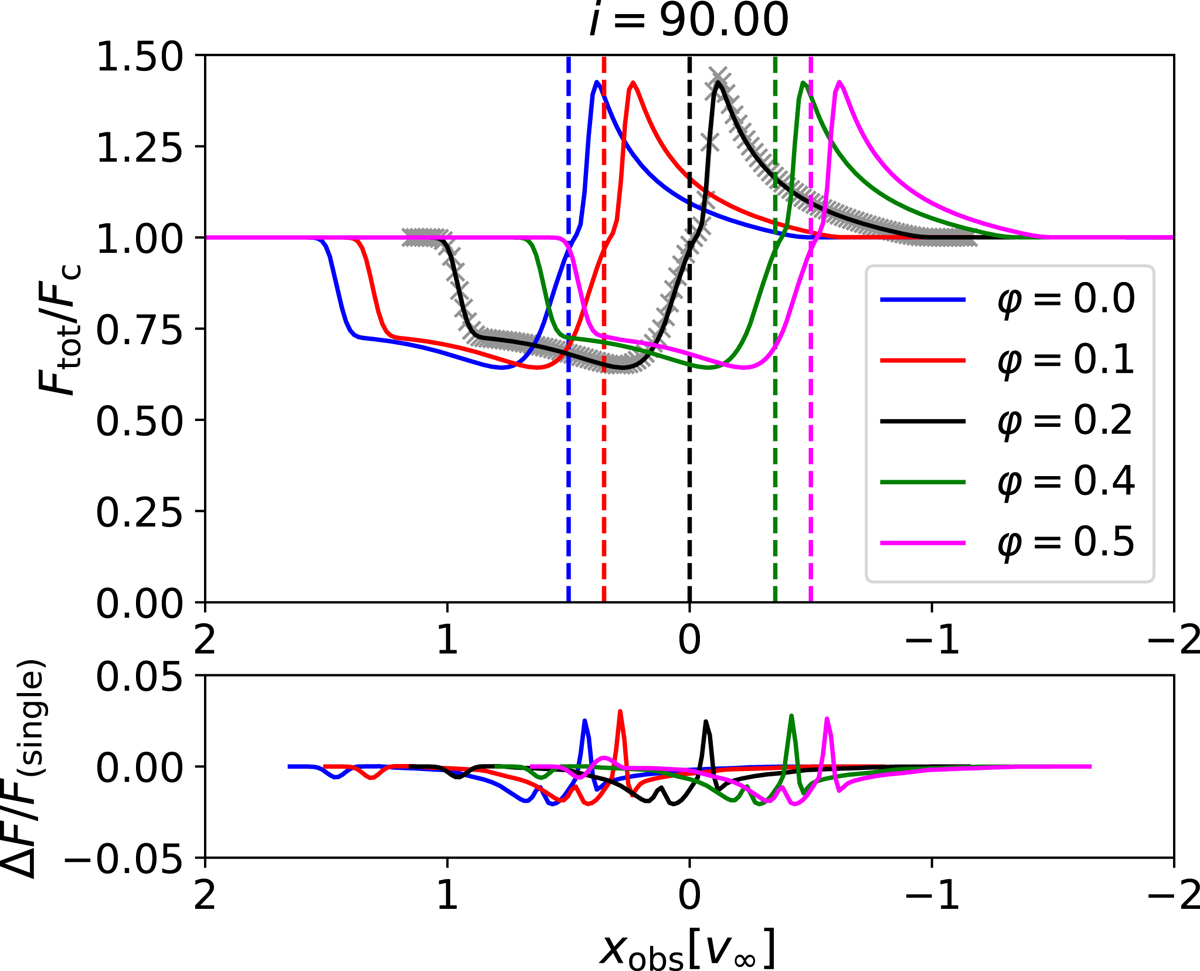
Fig. B.1.

Download original image
Top panel: Synthetic line profiles as a function of frequency shift from line centre in units of the terminal velocity for our spherically symmetric test model (see text). The solid lines indicate the line profiles as obtained from the binary code at different phases φ and a fixed inclination i = 90°, and the grey crosses correspond to the solution as obtained from the single-star code. The vertical dashed lines indicate the transition frequency of the line at the different phases for the assumed orbital configuration. Bottom panel: Relative error of the obtained line profiles at different phases when compared to the single-star code (shifted by the corresponding projected orbital velocities).
Current usage metrics show cumulative count of Article Views (full-text article views including HTML views, PDF and ePub downloads, according to the available data) and Abstracts Views on Vision4Press platform.
Data correspond to usage on the plateform after 2015. The current usage metrics is available 48-96 hours after online publication and is updated daily on week days.
Initial download of the metrics may take a while.


