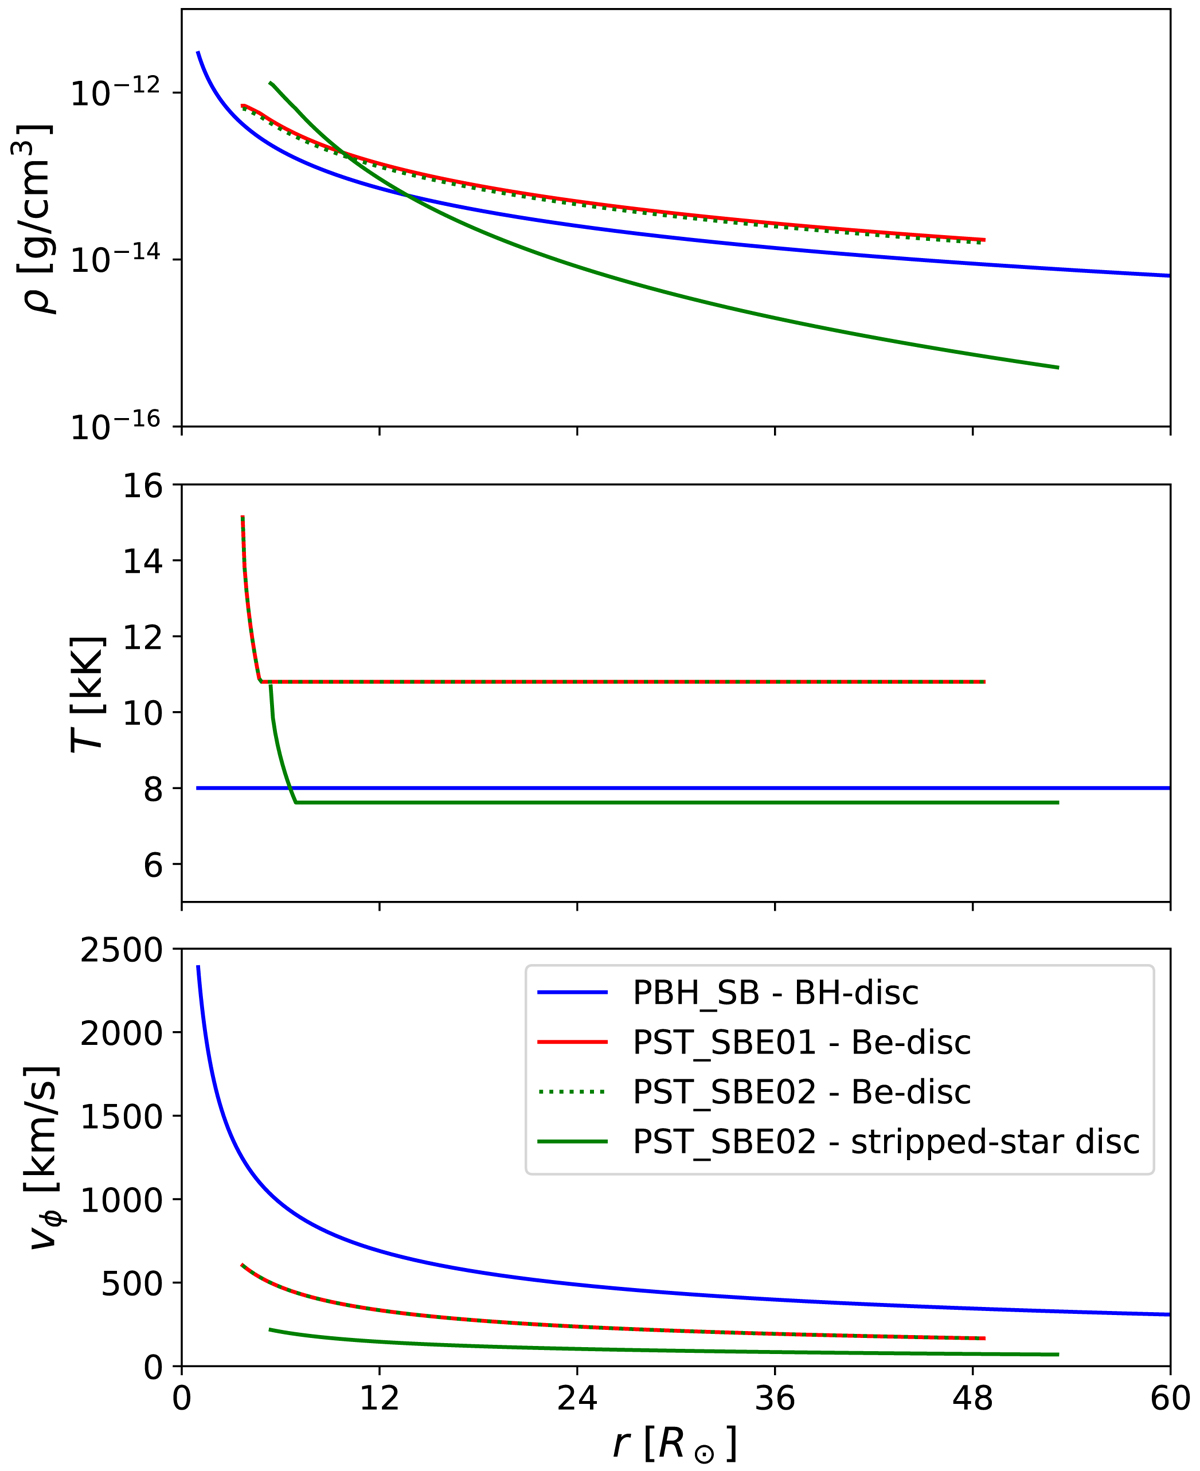
Fig. 3.
Download original image
Disc models in the equatorial plane corresponding to our best-fit parameters of the LB-1 system (see Table 3). The top and middle panels display the radial density and temperature stratification, respectively, and the azimuthal velocity component is shown in the bottom panel. The blue and red lines indicate the BH accretion disc (model PBH_SB) and the Be-star disc within the single-disc model (model PST_SBE01), respectively. For model PST_SBE02 (containing two discs), the Be-star disc is indicated by the green dotted line (partially overlapping with the red solid line from model PST_SBE01), and the stripped-star disc is indicated by the green solid line.
Current usage metrics show cumulative count of Article Views (full-text article views including HTML views, PDF and ePub downloads, according to the available data) and Abstracts Views on Vision4Press platform.
Data correspond to usage on the plateform after 2015. The current usage metrics is available 48-96 hours after online publication and is updated daily on week days.
Initial download of the metrics may take a while.