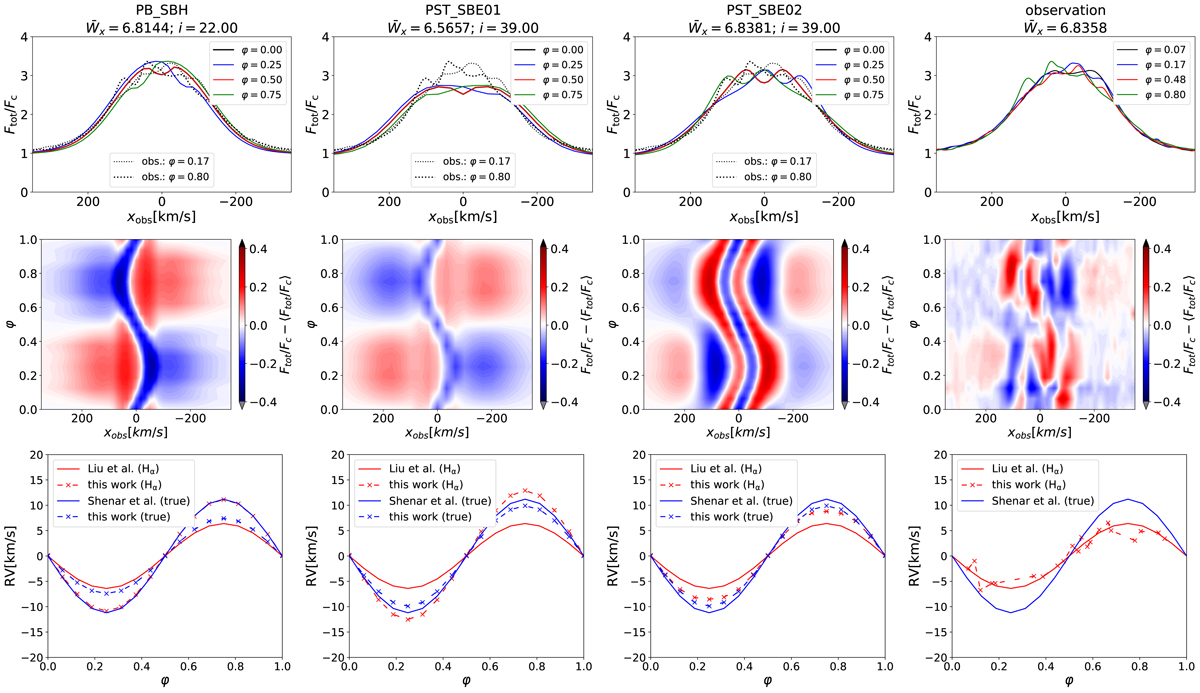
Fig. 2.
Download original image
Hα line profiles at different phases φ (top row) with corresponding mean-subtracted dynamical spectra (middle row) and radial velocity curves (bottom row) of the BH or strB companion. The xobs-axis describes the frequency shift from line centre expressed in velocity space. The first three columns to the left display the solution for the three different models, PB_SBH (primary: B star, secondary: BH), PST_SBE01 (primary: stripped star, secondary: Be-star, model 1), PST_SBE02 (primary: stripped star, secondary: Be-star, model 2), with Hα line profiles at two distinct phases from the actual observations indicated by the black dashed and dotted lines. The right column additionally displays the corresponding observed (see Shenar et al. 2020) Hα line profiles, mean-subtracted dynamical spectrum and radial velocity curves of LB-1, where we distinguish between the true ones (e.g., from using disentangling methods) indicated in blue and those obtained from the barycentric method applied to the Hα line wings (red). To reduce the noise, all observed line profiles have been convolved with a Gaussian filter of width 10 km s−1. The bottom panels display the radial velocity curves of the secondary when calculated from the barycentric method applied to the Hα line profile wings (red crosses) and when using the true orbital parameters (blue crosses). Additionally, we display the corresponding radial velocity curves as found by Shenar et al. (2020) and Liu et al. (2019) using disentangling techniques (blue solid line) and the barycentric method (red solid lines), respectively. At the top, the (phase-averaged) equivalent width evaluated in velocity space in units of 100 km s−1 and the inclination used within the synthetic-spectra calculations are indicated.
Current usage metrics show cumulative count of Article Views (full-text article views including HTML views, PDF and ePub downloads, according to the available data) and Abstracts Views on Vision4Press platform.
Data correspond to usage on the plateform after 2015. The current usage metrics is available 48-96 hours after online publication and is updated daily on week days.
Initial download of the metrics may take a while.