Fig. 9
Download original image
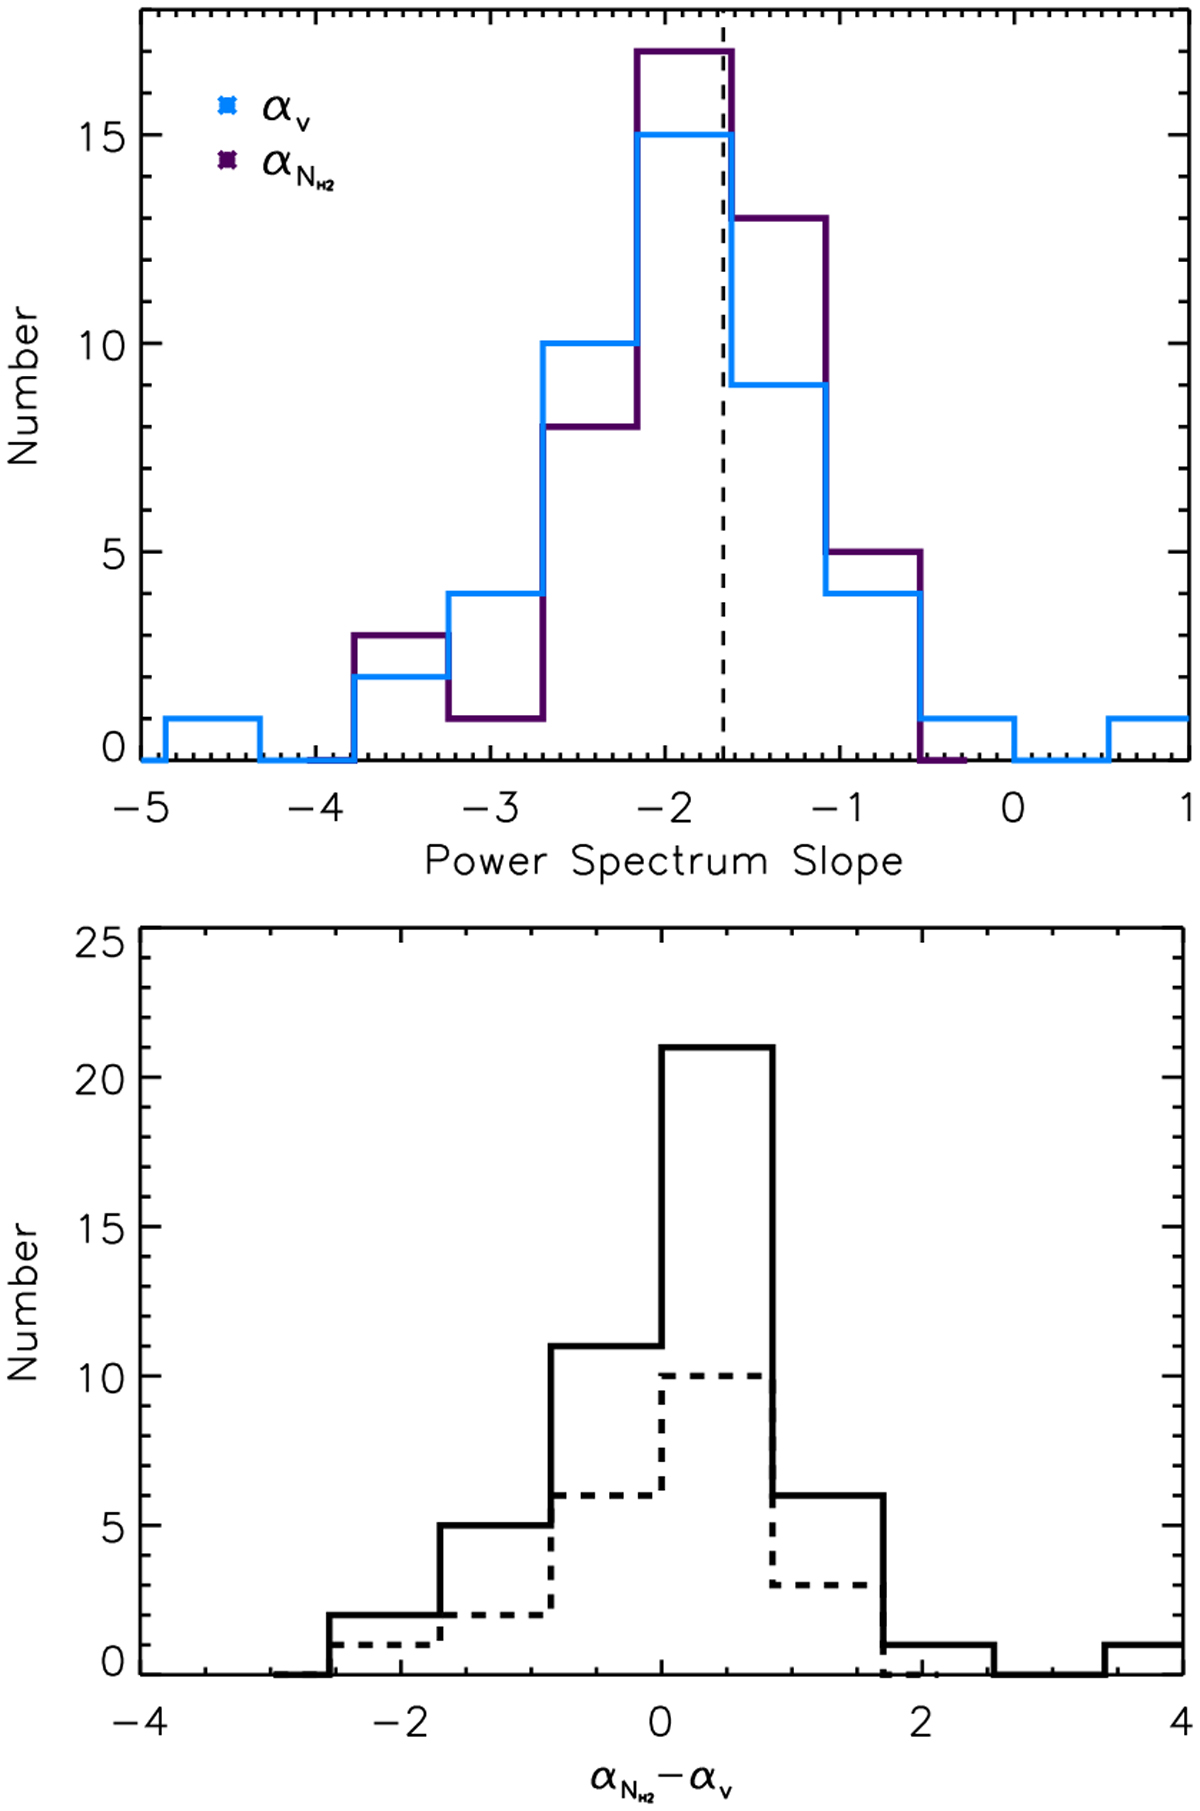
Distributions of the power spectrum slopes. Top: distribution of the power spectrum slopes of the column density (![]() ) and velocity (av) in purple and blue, respectively, for the 47 VCFs. The dashed vertical line indicates the -5/3 value. Bottom: difference between the power spectrum slopes of the column density and velocity (
) and velocity (av) in purple and blue, respectively, for the 47 VCFs. The dashed vertical line indicates the -5/3 value. Bottom: difference between the power spectrum slopes of the column density and velocity (![]() ). The solid and dashed histograms are for the 47 VCFs and the 22 VCFs with L > 10 pixels and L > 20 pixels, mean and standard deviation of 0.15 ± 0.99 and 0.07 ± 0.81, respectively.
). The solid and dashed histograms are for the 47 VCFs and the 22 VCFs with L > 10 pixels and L > 20 pixels, mean and standard deviation of 0.15 ± 0.99 and 0.07 ± 0.81, respectively.
Current usage metrics show cumulative count of Article Views (full-text article views including HTML views, PDF and ePub downloads, according to the available data) and Abstracts Views on Vision4Press platform.
Data correspond to usage on the plateform after 2015. The current usage metrics is available 48-96 hours after online publication and is updated daily on week days.
Initial download of the metrics may take a while.