Fig. 8
Download original image
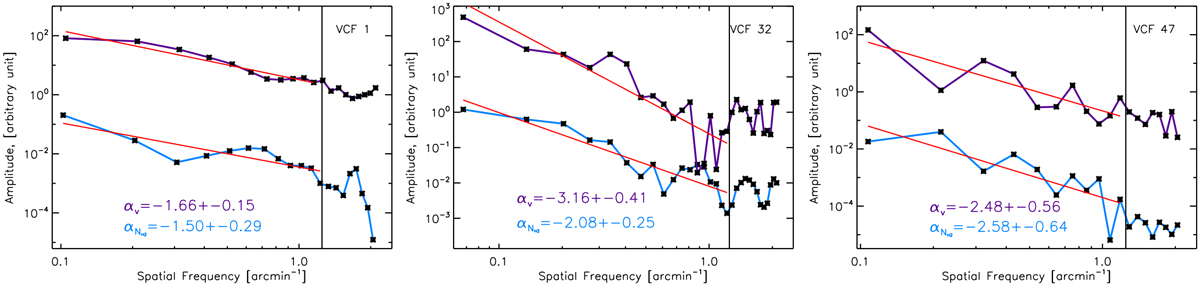
Power spectra of the column density (blue) and the velocity (purple) for the VCF crests 1 (left), 32 (middle), and 47 (right). The amplitudes of the power spectra are scaled so they can be plotted on the same panel. The red lines show the best linear fit to the power spectra and the values of the slopes are indicated in the corresponding panels. The vertical black solid lines indicate the 30.″2 angular resolution of the data equivalent to ~1.2 arcmin-1, which is the highest frequency data point used to fit the power spectra.
Current usage metrics show cumulative count of Article Views (full-text article views including HTML views, PDF and ePub downloads, according to the available data) and Abstracts Views on Vision4Press platform.
Data correspond to usage on the plateform after 2015. The current usage metrics is available 48-96 hours after online publication and is updated daily on week days.
Initial download of the metrics may take a while.