Fig. 7
Download original image
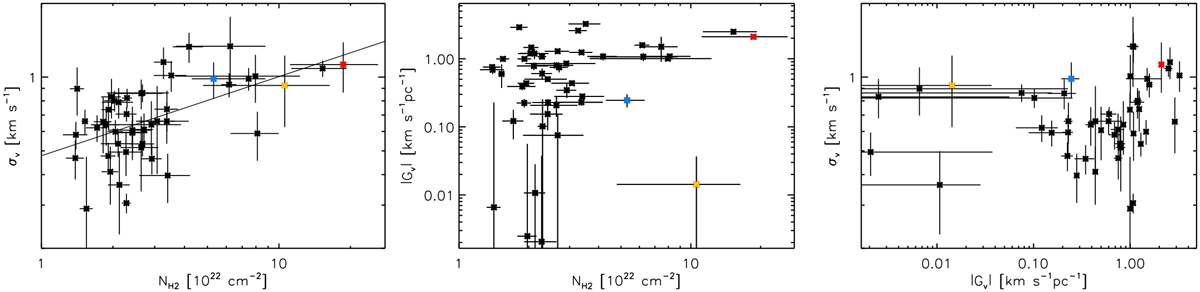
Scatter plots of measured parameters for the 47 VCFs. The values are averaged along the crests of the VCFs. The data points in red, yellow, and blue indicate VCFs 1, 32, and 47, respectively. Left: velocity dispersion vs. column density. The horizontal and vertical bars indicate the 1s dispersions of ![]() and sv about their average value along the crests. The diagonal line shows the best power-law fit
and sv about their average value along the crests. The diagonal line shows the best power-law fit ![]() . Middle: velocity gradient Gv (given in absolute value) vs. column density. The horizontal bars indicate the 1s dispersion of
. Middle: velocity gradient Gv (given in absolute value) vs. column density. The horizontal bars indicate the 1s dispersion of ![]() (same as left panel). The vertical bars give the 1s uncertainty of the linear fits to the velocity fluctuations along the crests. Right: velocity dispersion vs. Gv (given in absolute value).
(same as left panel). The vertical bars give the 1s uncertainty of the linear fits to the velocity fluctuations along the crests. Right: velocity dispersion vs. Gv (given in absolute value).
Current usage metrics show cumulative count of Article Views (full-text article views including HTML views, PDF and ePub downloads, according to the available data) and Abstracts Views on Vision4Press platform.
Data correspond to usage on the plateform after 2015. The current usage metrics is available 48-96 hours after online publication and is updated daily on week days.
Initial download of the metrics may take a while.