Fig. 5
Download original image
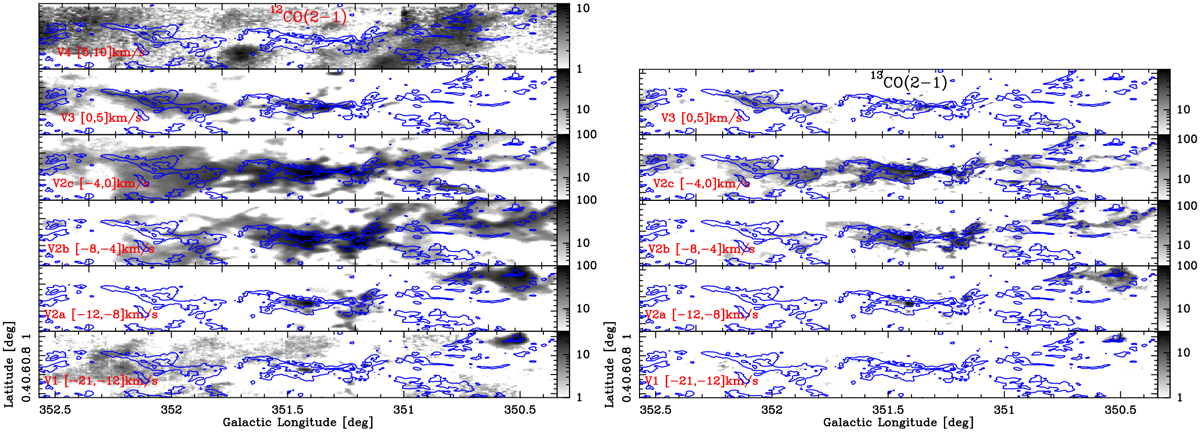
Velocity channel maps in units of K kms-1 for the 12CO(2–1) and 13CO(2–1) emission (left and right, respectively). The velocity ranges of the channel maps are indicated at the bottom left of each panel. The range of the color scale (indicated by the bar for each panel) is different for each plot. This scale was chosen to represent the dynamical range of the emission for each velocity channel map.
Current usage metrics show cumulative count of Article Views (full-text article views including HTML views, PDF and ePub downloads, according to the available data) and Abstracts Views on Vision4Press platform.
Data correspond to usage on the plateform after 2015. The current usage metrics is available 48-96 hours after online publication and is updated daily on week days.
Initial download of the metrics may take a while.