Fig. 4
Download original image
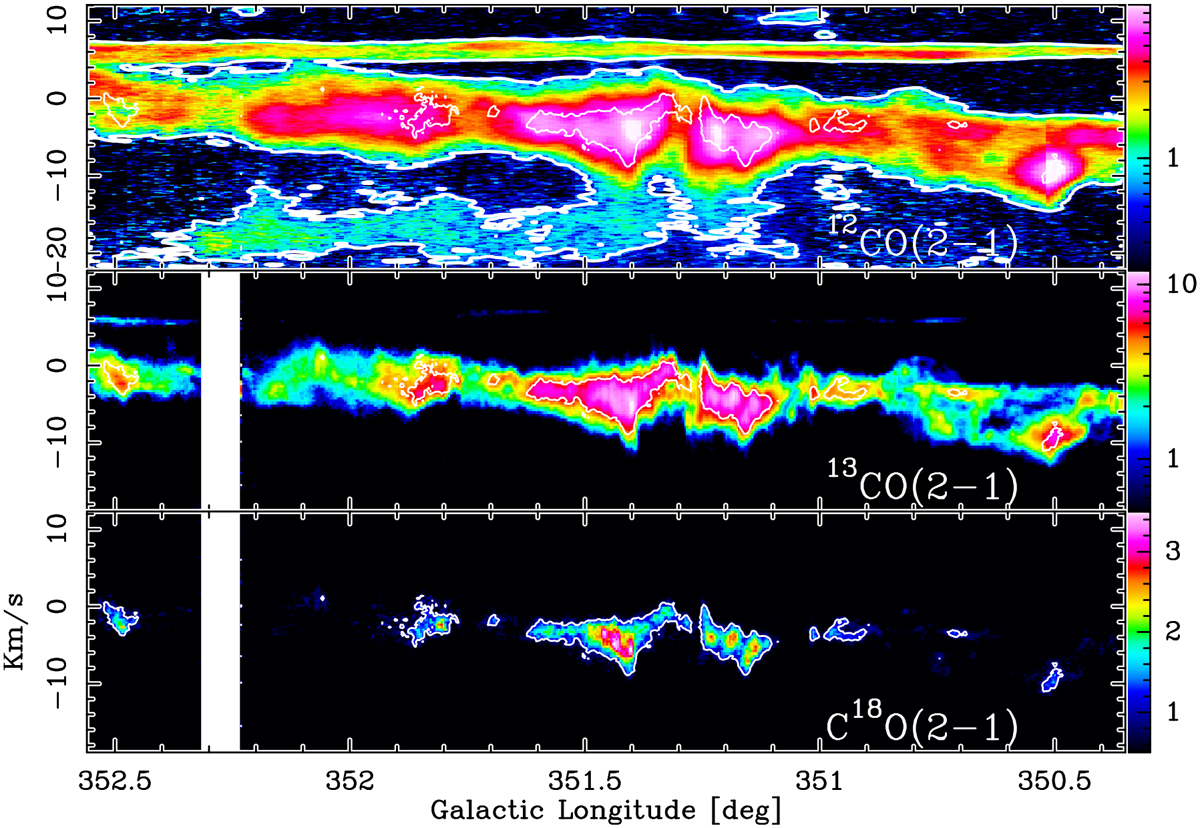
Position–velocity (PV) diagrams in units of K(TMB) for the 12CO(2-1), 13CO(2-1), and C18O(2-1) emission (from top to bottom). The 13CO(2-1) and C18O(2-1) maps have a spatial resolution of 30.″2. The 12CO(2-1) map has a spatial resolution of 90″. These PV diagrams are averaged in latitude across the cloud for 0.″4 = b = 1″. The white contours indicate the C18O(2–1) intensity at 1 K and are the same for the three panels. In the top panel the thick white contour corresponds to the 12CO(2–1) intensity at 0.6 K.
Current usage metrics show cumulative count of Article Views (full-text article views including HTML views, PDF and ePub downloads, according to the available data) and Abstracts Views on Vision4Press platform.
Data correspond to usage on the plateform after 2015. The current usage metrics is available 48-96 hours after online publication and is updated daily on week days.
Initial download of the metrics may take a while.