Fig. 3
Download original image
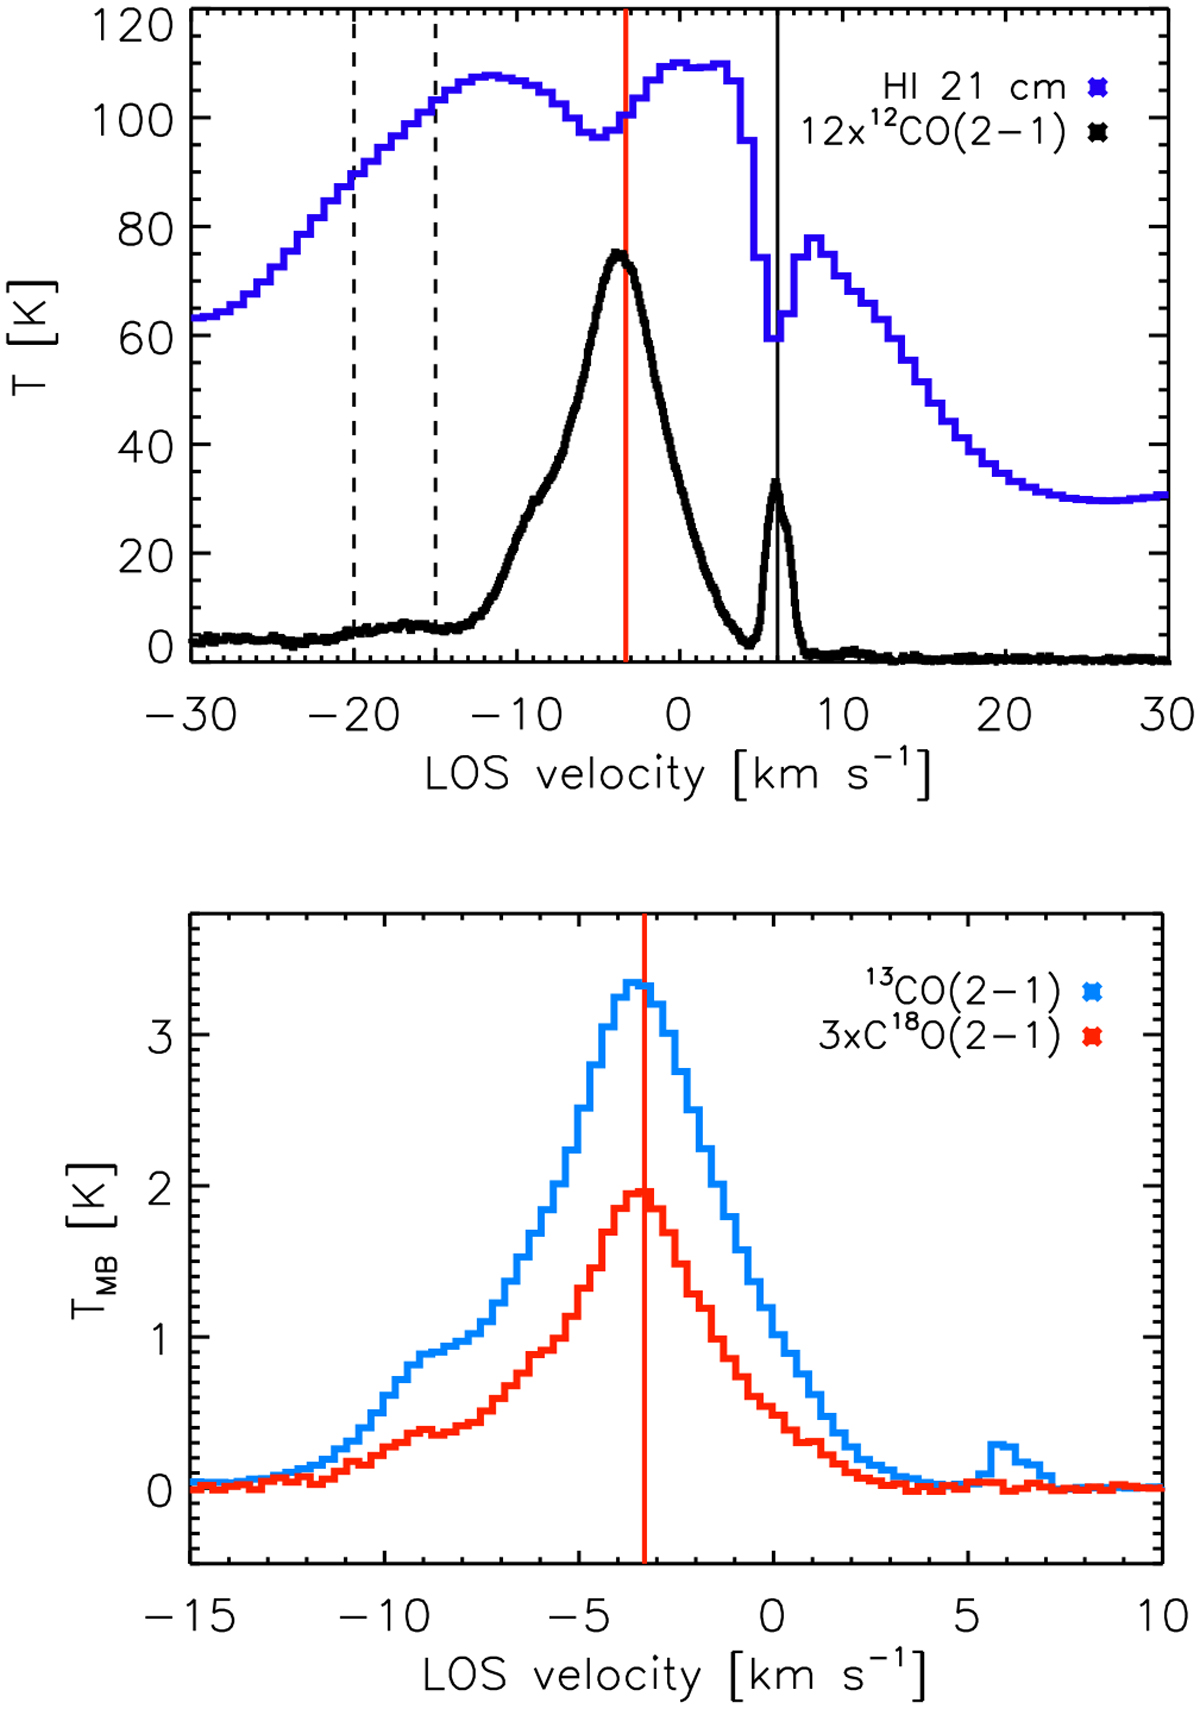
Positionally averaged spectra for the observed molecular and atomic emission. The spectra are averaged across the same observed region defined by the footprint of the APEX maps (cf. Fig. 2). The red vertical line indicates the peak position of the 13CO(2–1) and C18O(2–1) emission at -3.3 kms-1. The solid black vertical line gives the position of the extended emission at 6 km s-1, observed in emission and absorption, in 12CO(2–1) and HI, respectively. The dashed black vertical lines indicate the extent of the cloud emission identified in the 12CO(2–1) V1 velocity range (see Sect. 3.2).
Current usage metrics show cumulative count of Article Views (full-text article views including HTML views, PDF and ePub downloads, according to the available data) and Abstracts Views on Vision4Press platform.
Data correspond to usage on the plateform after 2015. The current usage metrics is available 48-96 hours after online publication and is updated daily on week days.
Initial download of the metrics may take a while.