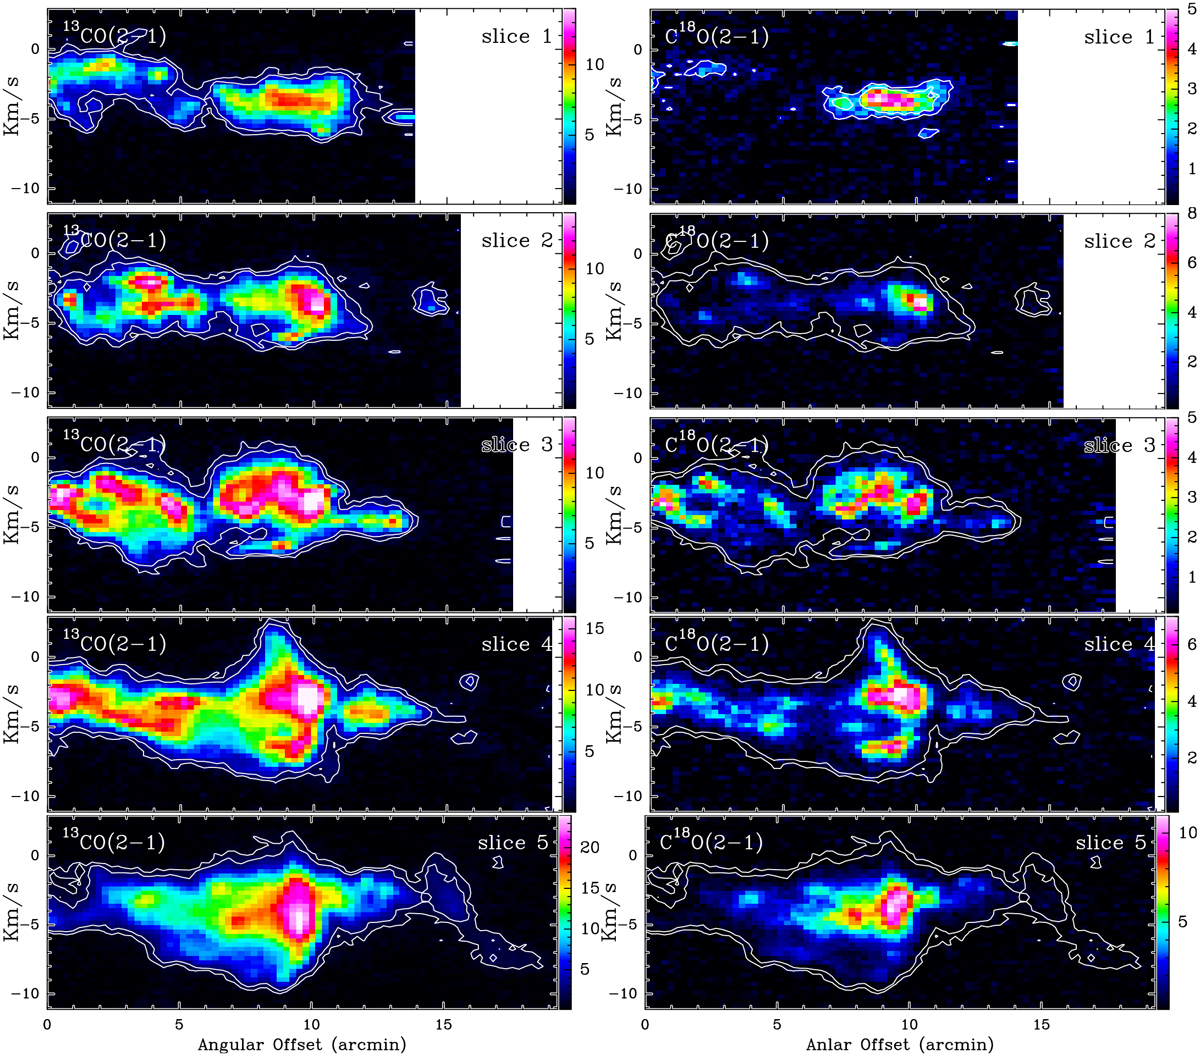
Fig. C.1
Download original image
Longitudinal position–velocity (PV) diagrams along the crest of VCF 32 for the 13CO(2–1) and C18O(2–1) emission (left and right, respectively). The PV maps are in units of K(TMB). Each PV diagram is perpendicular to the crest and averaged over 4 pixels (2×beams). The slices from 1 to 5 correspond to positions along the crest from east to west. The central positions of the slices are indicated on Fig. B.3. The white contours indicate the 13CO(2–1) intensity of 1 K and 2 K and are the same for the two panels of the same slice. The zero offset position (on the x-axes) corresponds to the Galactic south side of the filament systems. At the distance of this cloud 10’ corresponds to 3.8 pc. The position of the filaments is between 9’ and 10’.
Current usage metrics show cumulative count of Article Views (full-text article views including HTML views, PDF and ePub downloads, according to the available data) and Abstracts Views on Vision4Press platform.
Data correspond to usage on the plateform after 2015. The current usage metrics is available 48-96 hours after online publication and is updated daily on week days.
Initial download of the metrics may take a while.