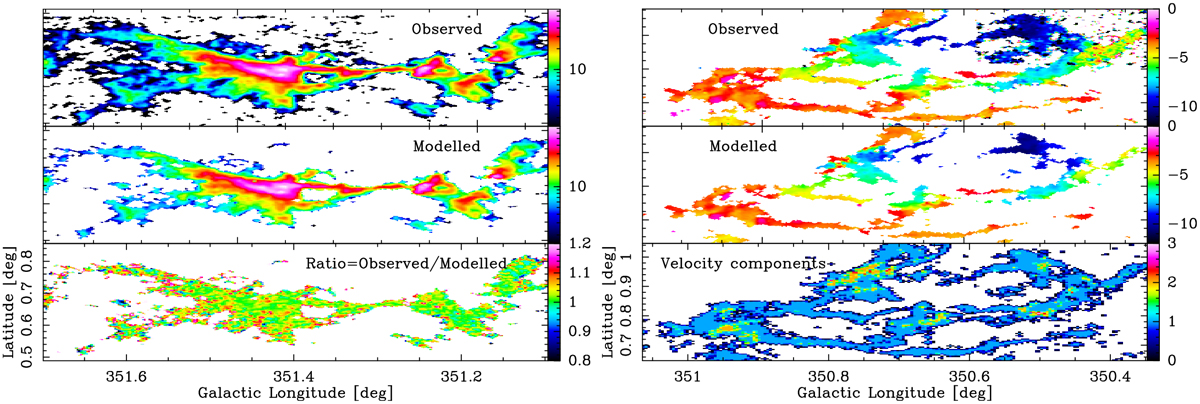
Fig. B.2
Download original image
Examples of observed and modeled maps. Left: Observed and modeled moment zero map of the C18O(2–1) emission toward the MFS (top and bottom, respectively). The intensity is shown in K km s-1. The bottom map shows the ratio of the above two maps. The median, mean, and standard deviation values of this ratio map are 1.02, 1.10, and 0.46, resepctively. Right: Observed and modeled moment one map of the C18O(2–1) emission toward the GM24FS (top and bottom, respectively). The unit of the maps is km s-1. The bottom map shows the number of velocity components fitted for each pixel (toward each LOS).
Current usage metrics show cumulative count of Article Views (full-text article views including HTML views, PDF and ePub downloads, according to the available data) and Abstracts Views on Vision4Press platform.
Data correspond to usage on the plateform after 2015. The current usage metrics is available 48-96 hours after online publication and is updated daily on week days.
Initial download of the metrics may take a while.