Fig. A.1
Download original image
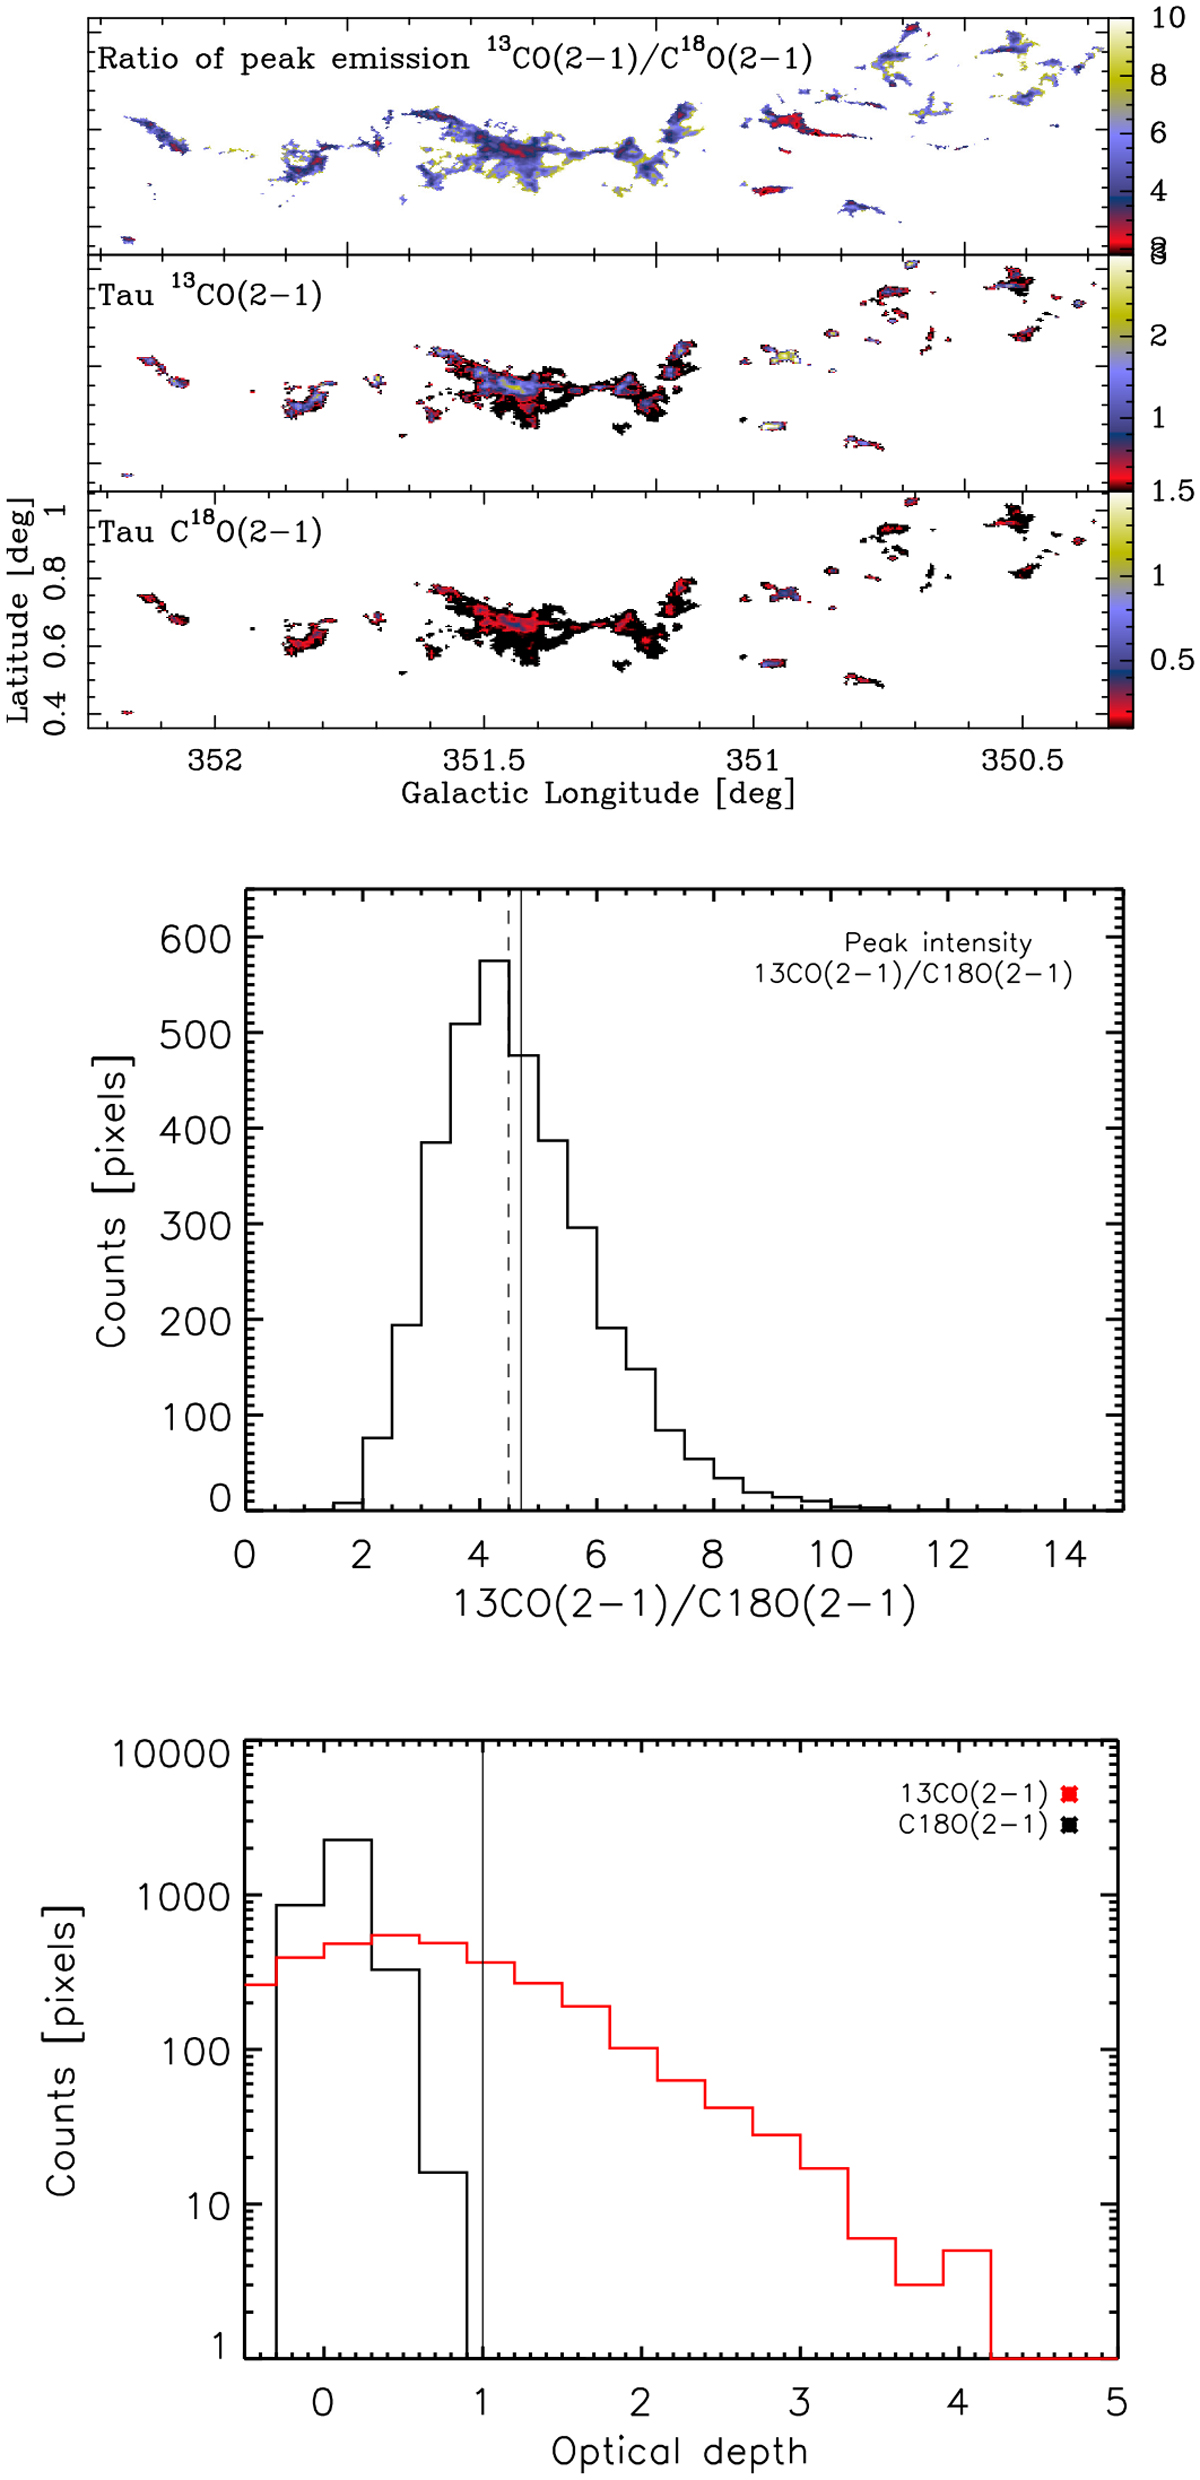
Intensity ratio and optical depth estimates. Top: Ratio map ![]() , t13, and t18 (from top to bottom). The ratio map is derived from the peak emission at the spatial resolution of 30″. Only pixels with T18 > 3s have been considered, where s = 0.4 K. Middle: Distribution of the values of the ratio map. Bottom: Distribution of the optical depth of respectively. The C18O(2–1) emission is optically thin over the entire studied region.
, t13, and t18 (from top to bottom). The ratio map is derived from the peak emission at the spatial resolution of 30″. Only pixels with T18 > 3s have been considered, where s = 0.4 K. Middle: Distribution of the values of the ratio map. Bottom: Distribution of the optical depth of respectively. The C18O(2–1) emission is optically thin over the entire studied region.
Current usage metrics show cumulative count of Article Views (full-text article views including HTML views, PDF and ePub downloads, according to the available data) and Abstracts Views on Vision4Press platform.
Data correspond to usage on the plateform after 2015. The current usage metrics is available 48-96 hours after online publication and is updated daily on week days.
Initial download of the metrics may take a while.