Fig. 12
Download original image
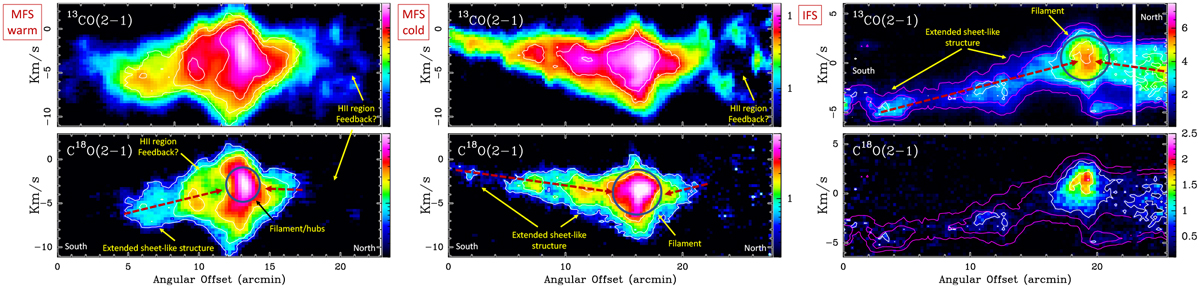
Position-velocity (PV) diagrams perpendicular to and averaged along the main axes of the MFS-warm, MFS-cold, and IFS regions (from left to right, see boxes in Fig. 6). The PV maps are in units of K(TMB) and correspond to the 13CO(2–1) and C18O(2–1) emission at the top and bottom, respectively. The white contours indicate the C18O(2–1) intensity and are the same for the two panels of the same filament system. The magenta contours in the left panel correspond to the 13CO(2–1) intensity. The zero offset position (on the x-axes) corresponds to the Galactic south side of the filament systems. At the distance of this cloud 10’ corresponds to 3.8 pc. The position of the filaments are indicated with a dark blue circle and the velocity gradients induced by the compression are shown as converging red dashed arrows toward the filament. Longitudinal PV diagrams along the crest of VCF 32 of the MFS-cold region are shown in Fig. C.1.
Current usage metrics show cumulative count of Article Views (full-text article views including HTML views, PDF and ePub downloads, according to the available data) and Abstracts Views on Vision4Press platform.
Data correspond to usage on the plateform after 2015. The current usage metrics is available 48-96 hours after online publication and is updated daily on week days.
Initial download of the metrics may take a while.