Fig. 11
Download original image
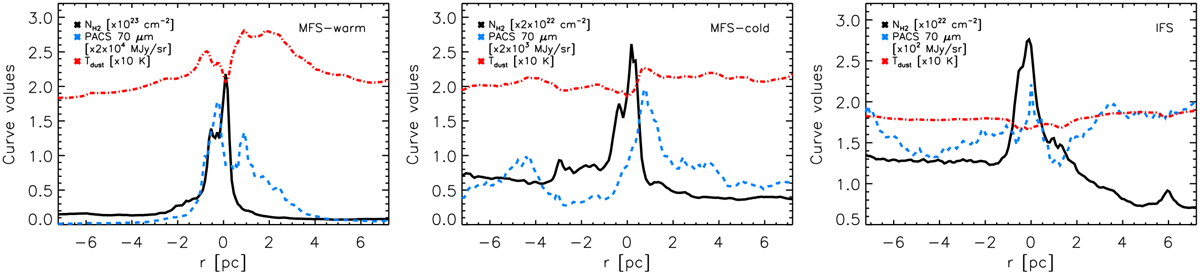
Radial profiles across the MFS-warm, MFS-cold, and IFS regions (from left to right; see boxes in Fig. 6). The column density, the PACS 70 µm emission, and the dust temperature are shown as solid black, blue dashed, and red dot-dashed lines, respectively. The scaling of the different curves is indicated in the caption of each panel. The r > 0 values correspond to the Galactic north.
Current usage metrics show cumulative count of Article Views (full-text article views including HTML views, PDF and ePub downloads, according to the available data) and Abstracts Views on Vision4Press platform.
Data correspond to usage on the plateform after 2015. The current usage metrics is available 48-96 hours after online publication and is updated daily on week days.
Initial download of the metrics may take a while.