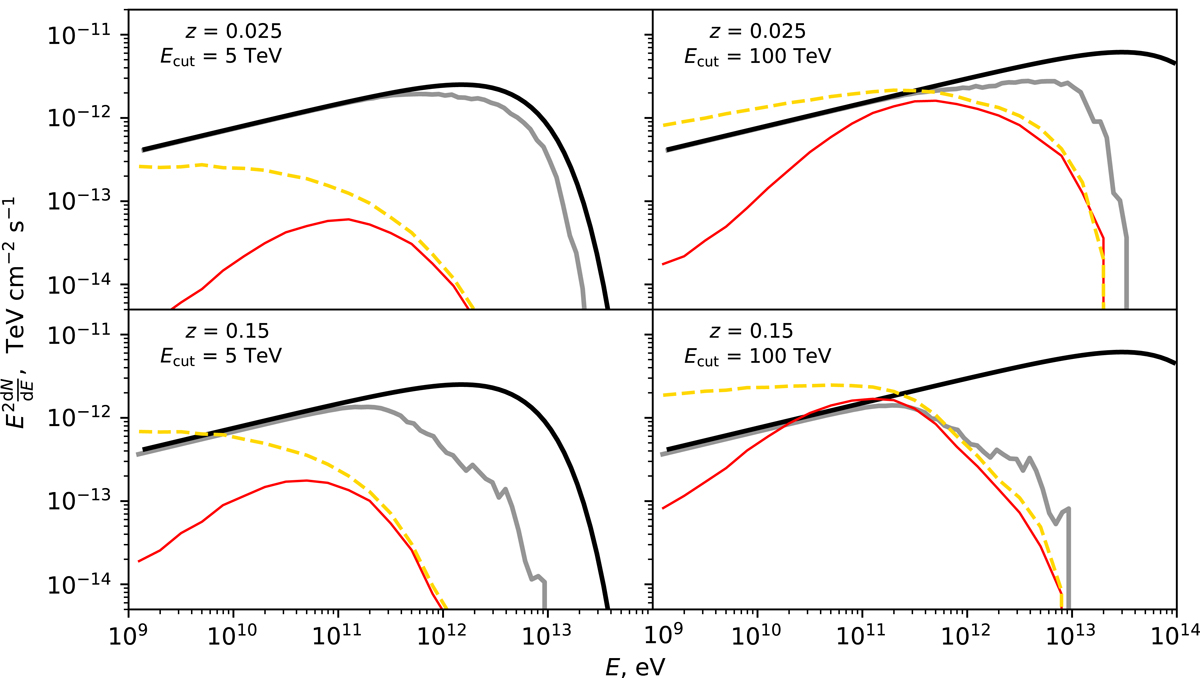
Fig. 3.
Download original image
Primary and secondary γ-ray spectra for the “only voids” magnetic field profile (only regions with B ≤ 10−12 G are taken into account). Different subplots represent different parameters of the source. Solid black and gray lines are the intrinsic and observed primary source spectra. Dashed yellow lines show the secondary γ-ray flux for a zero line of sight magnetic field. Solid red lines show the secondary γ-ray flux with a nonzero magnetic field in the voids.
Current usage metrics show cumulative count of Article Views (full-text article views including HTML views, PDF and ePub downloads, according to the available data) and Abstracts Views on Vision4Press platform.
Data correspond to usage on the plateform after 2015. The current usage metrics is available 48-96 hours after online publication and is updated daily on week days.
Initial download of the metrics may take a while.