Free Access
Fig. 1.
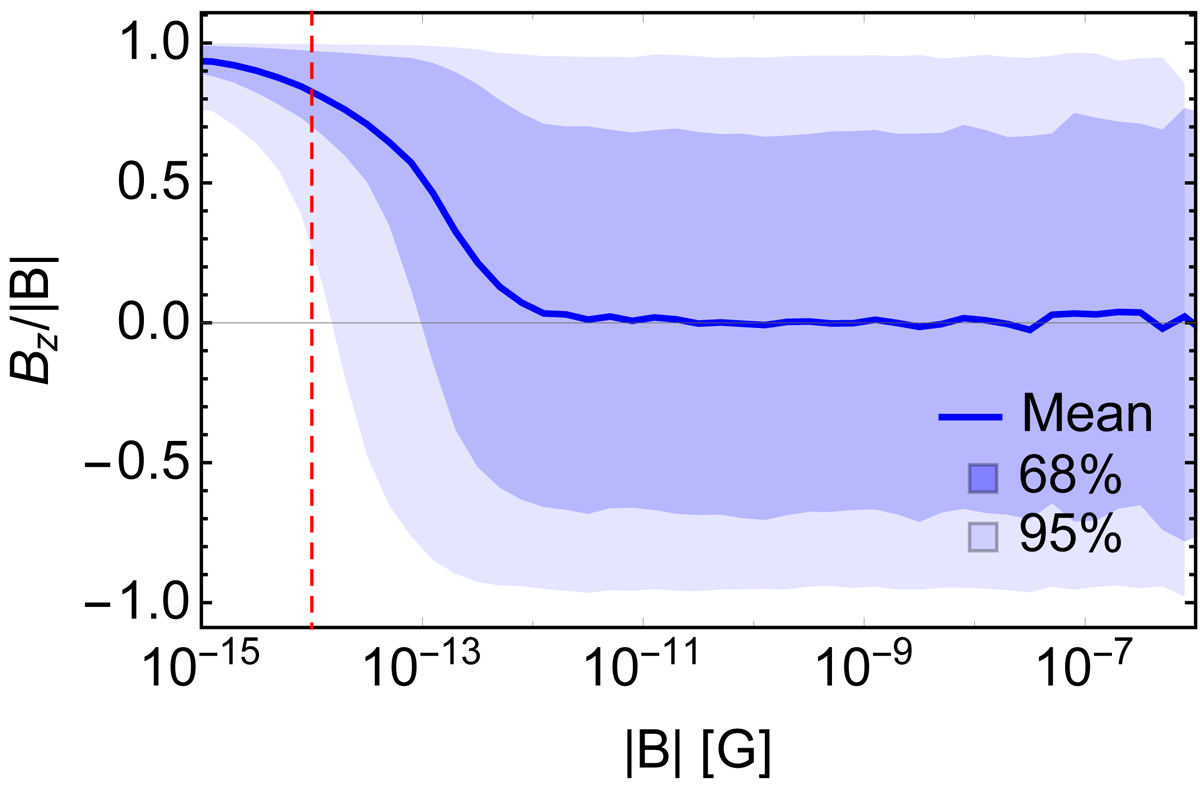
Download original image
Orientation of the magnetic field along the z direction as a function of the magnetic field strength at redshift 0. The blue line shows the mean value, while shaded dark and light blue regions represent areas with 68% and 95% of simulation volume. The dashed red line shows the seed magnetic field value B = 10−14 G.
Current usage metrics show cumulative count of Article Views (full-text article views including HTML views, PDF and ePub downloads, according to the available data) and Abstracts Views on Vision4Press platform.
Data correspond to usage on the plateform after 2015. The current usage metrics is available 48-96 hours after online publication and is updated daily on week days.
Initial download of the metrics may take a while.