Fig. D.4.
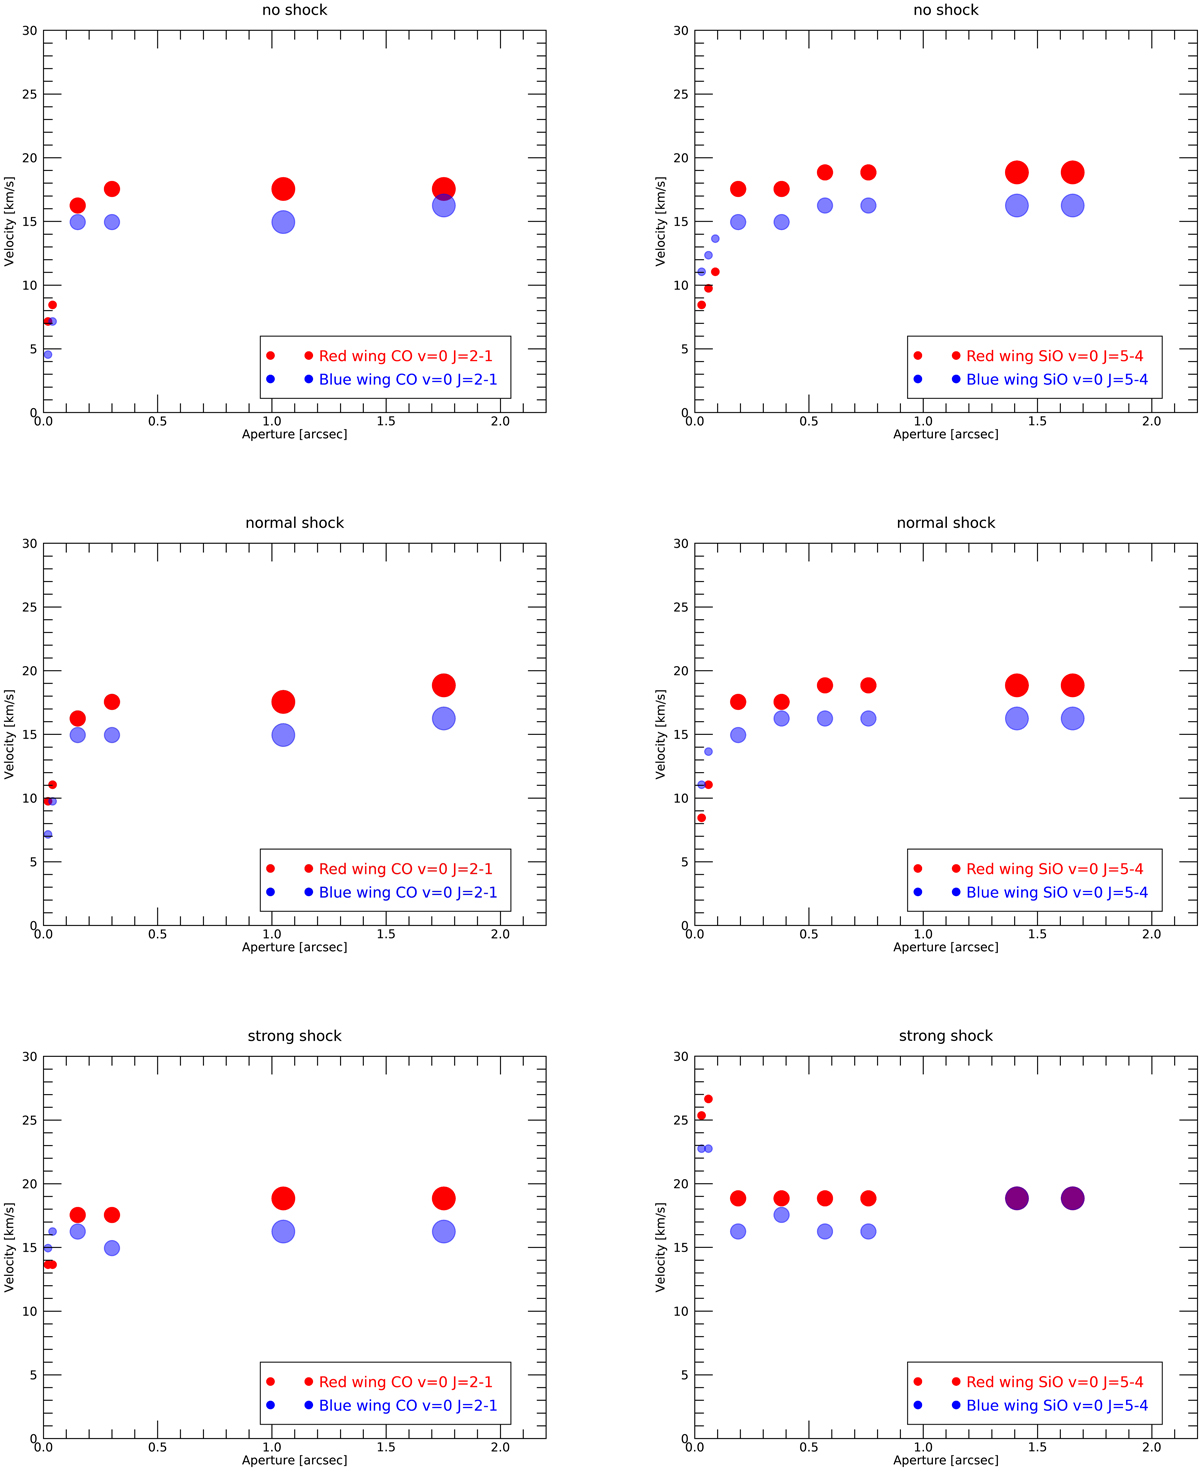
Download original image
Simulated wind velocity measures for 12CO v = 0 J=2=1 (left) and 12SiO v = 0 J=5-4 (right). The upper row depicts the model without shocks, the middle (bottom) row the shocked wind model for the velocity profile shown in the left (right) panel of Fig. D.3. The calculated intensities of 12CO and 12SiO account for the different array configurations and extraction apertures in ATOMIUM (see Sect. 3 for details). The velocity measures for the extended (small dots), medium (medium-sized dots), and compact (large dots) configurations were extracted by following Step 1 and Step 2 in Sect. 5.2. The blue dots representing the blue wing velocities are slightly transparent to allow for visualising the red wing velocities in cases where the red and blue dots coincide.
Current usage metrics show cumulative count of Article Views (full-text article views including HTML views, PDF and ePub downloads, according to the available data) and Abstracts Views on Vision4Press platform.
Data correspond to usage on the plateform after 2015. The current usage metrics is available 48-96 hours after online publication and is updated daily on week days.
Initial download of the metrics may take a while.