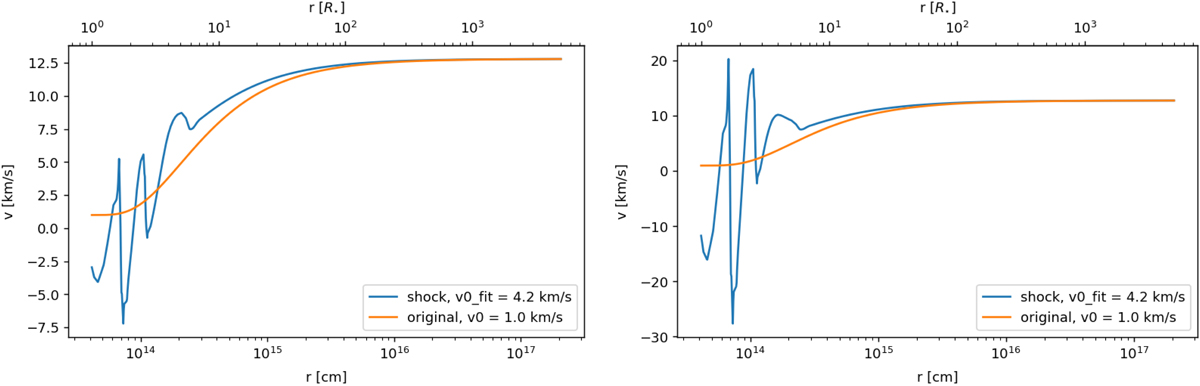
Fig. D.3.
Download original image
Wind velocity profile mimicking pulsation-induced shocks just above the stellar atmosphere. The orange curve shows a beta velocity wind profile for β = 5 and v0 = 1 km s−1. The blue curve in the left panel is constructed by: (i) using the shock velocity modelled by Bladh et al. (2019, see their Fig. 1) up to ∼10 R⋆ followed by; (ii) a beta velocity profile that is fitted through the velocity points beyond ∼8 R⋆, with β = 5 and the fit parameter v0 which produces a smooth transition from the pulsation-dominated region towards the freely expanding wind region. In the right panel, the blue curve is constructed in a similar way as in the left panel, but this time the shock velocities modelled by Bladh et al. (2019) are multiplied by a factor of 3.
Current usage metrics show cumulative count of Article Views (full-text article views including HTML views, PDF and ePub downloads, according to the available data) and Abstracts Views on Vision4Press platform.
Data correspond to usage on the plateform after 2015. The current usage metrics is available 48-96 hours after online publication and is updated daily on week days.
Initial download of the metrics may take a while.