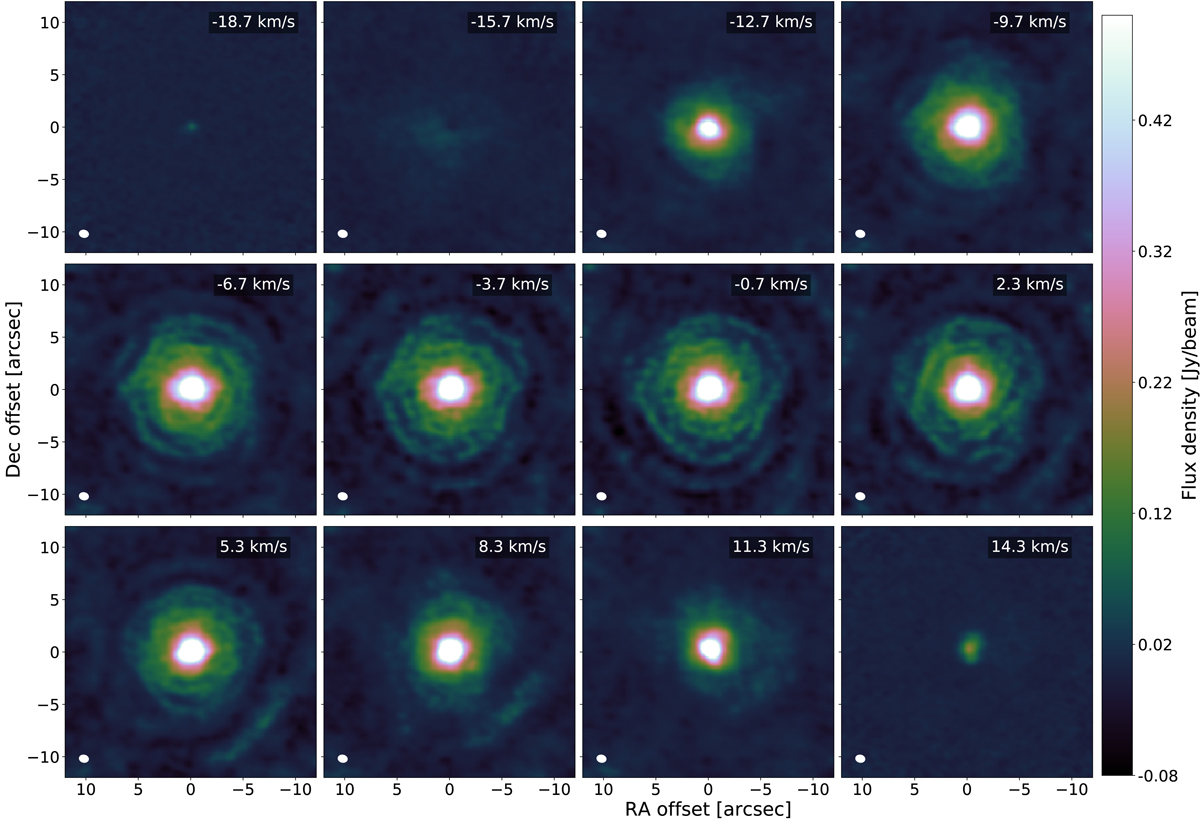
Fig. 3.
Download original image
Low resolution channel map of 12CO v = 0 J = 2 − 1 in IRC −10529. The peak of the continuum emission is at (0,0). The velocity (in km s−1) is with respect to the stellar velocity of −16.3 km s−1 (see the last column in Table 1), and is indicated in the upper right corner of each panel. The ALMA synthesized beam is shown as a white ellipse in the lower left corner of each panel (see Table E.2). The offsets in right ascension and declination are with respect to the peak of the continuum emission.
Current usage metrics show cumulative count of Article Views (full-text article views including HTML views, PDF and ePub downloads, according to the available data) and Abstracts Views on Vision4Press platform.
Data correspond to usage on the plateform after 2015. The current usage metrics is available 48-96 hours after online publication and is updated daily on week days.
Initial download of the metrics may take a while.