Free Access
Fig. 2.
Download original image
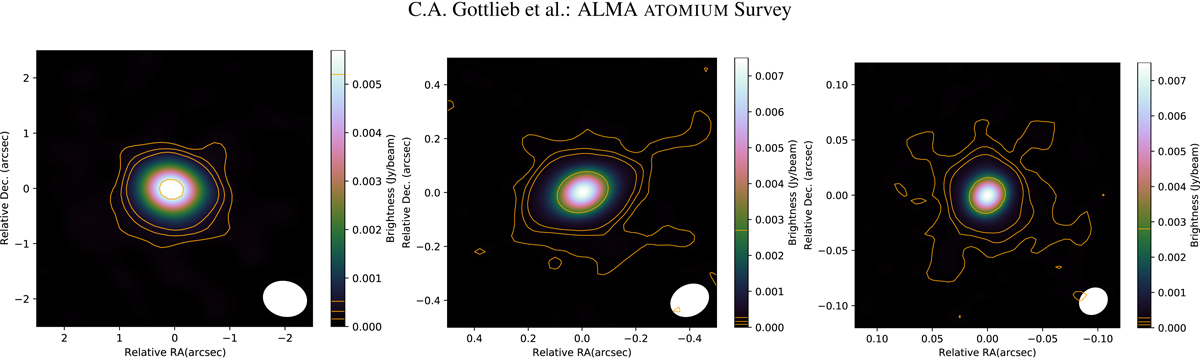
Continuum-maps of IRC −10529. Low (left panel), medium (middle panel), and high (right panel) spatial resolution continuum map. Contours (in orange) are indicated in steps of (3, 6, 10, 100)![]() (see Table E.2). The ALMA synthesized beam is shown as a white ellipse in the lower right corner of each panel (see Table E.2).
(see Table E.2). The ALMA synthesized beam is shown as a white ellipse in the lower right corner of each panel (see Table E.2).
Current usage metrics show cumulative count of Article Views (full-text article views including HTML views, PDF and ePub downloads, according to the available data) and Abstracts Views on Vision4Press platform.
Data correspond to usage on the plateform after 2015. The current usage metrics is available 48-96 hours after online publication and is updated daily on week days.
Initial download of the metrics may take a while.