Fig. A.4.
Download original image
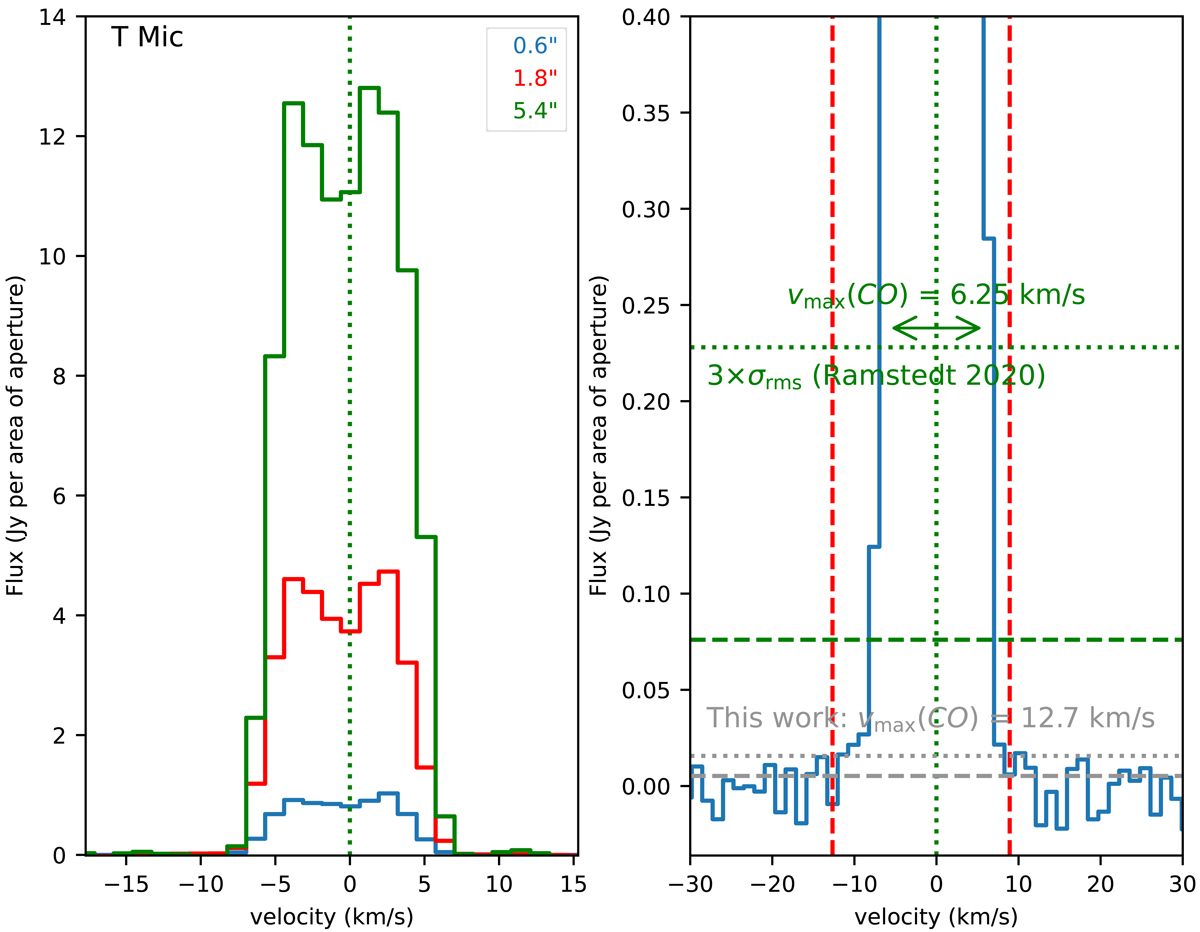
The J = 2 − 1 line of CO at 230,538.000 MHz observed in T Mic in the compact configuration. The plots show how (in the example of T Mic) the velocity (vmax) was derived from the molecular lines observed in the ATOMIUM survey. Left: The CO spectra extracted with apertures of radius 0.6″ (blue), 1.8″ (red), and 5.4″ (green). Right: The CO profile extracted with an aperture of radius 2.06″ is plotted on an expanded flux density scale with a full scale amplitude of 0.4 Jy/beam to better discern the red and blue wings. The horizontal dashed grey line at 5 mJy beam−1 corresponds to the 1σ peak rms noise (see point #2 in Sect. 5.2); the horizontal dotted grey line at 15 mJy beam−1 corresponds to the 3σ peak rms noise; the green dotted vertical line denotes the line center of CO at the vLSR of +25.5 km/sec; and the red dashed vertical lines indicate the blue wing velocity of −12.7 km s−1, and the red wing velocity of 8.9 km s−1. The value of vmax(CO) with the largest magnitude – i.e., the blue wing velocity of 12.7 km s−1 – is designated as the ‘velocity measure’ of the CO J = 2 − 1 transition in T Mic (see Sect. 5.2). Similarly, the dashed green horizontal line at 76 mJy beam−1 corresponds to the 1σrms noise in the Band 6 spectrum of CO observed in T Mic by Ramstedt et al. (2020, see Table B.1). The dotted green horizontal line at 228 mJy beam−1 corresponds to the 3σrms noise and to the point where the full width of the CO J = 2 − 1 line profile is equal to 12.5 km s−1, whereby Ramstedt et al. determined vmax(CO) = 6.25 km s−1.
Current usage metrics show cumulative count of Article Views (full-text article views including HTML views, PDF and ePub downloads, according to the available data) and Abstracts Views on Vision4Press platform.
Data correspond to usage on the plateform after 2015. The current usage metrics is available 48-96 hours after online publication and is updated daily on week days.
Initial download of the metrics may take a while.