Fig. A.2.
Download original image
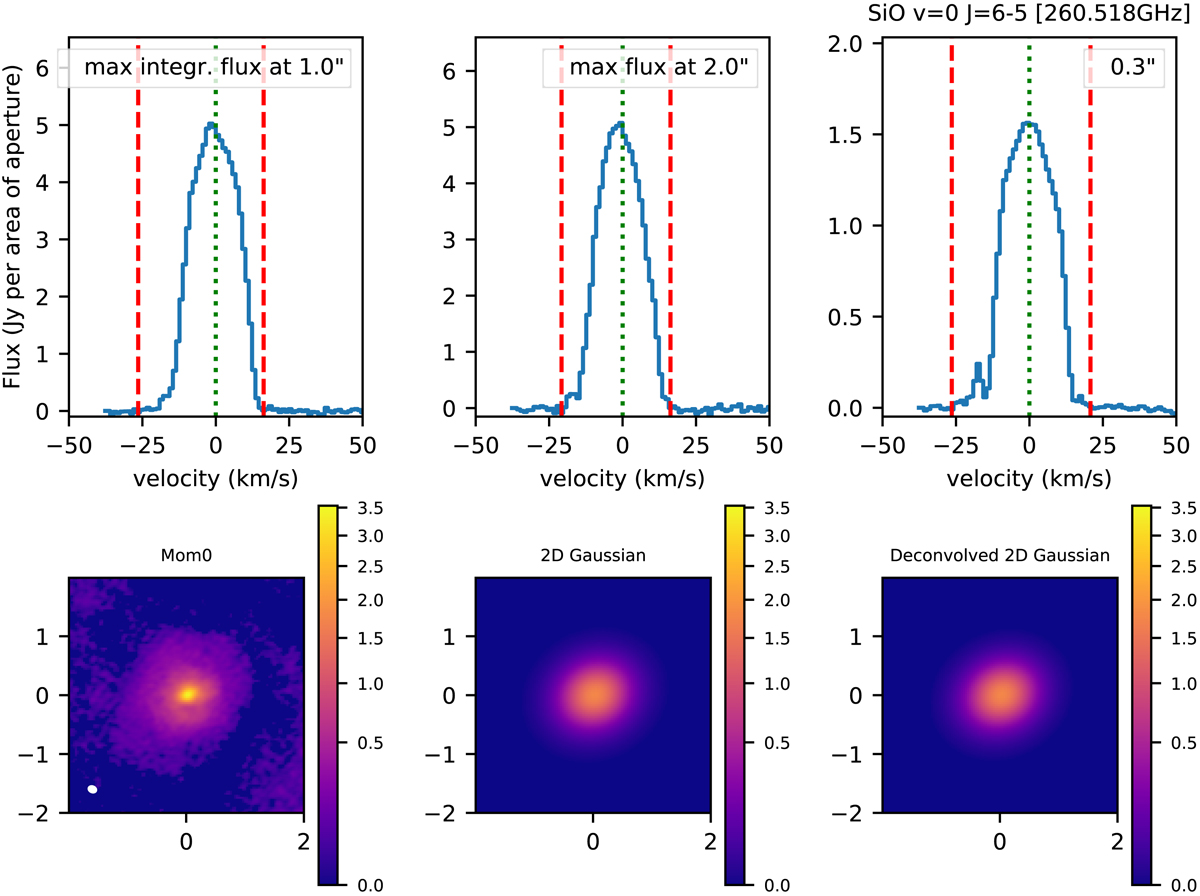
Determination of the velocity measure and angular emission zone for the SiO v = 0 J=6-5 transition of the medium resolution data of IRC −10529.Top row: The maximum integrated flux is attained for an extraction aperture of 1![]() 0 (left panel), the peak flux is maximal for an extraction aperture of 2
0 (left panel), the peak flux is maximal for an extraction aperture of 2![]() 0 (middle panel), and for each transition a reference spectrum at 0
0 (middle panel), and for each transition a reference spectrum at 0![]() 3 is plotted (right panel). The velocity (in km s−1) is with respect to the stellar velocity of −16.3 km s−1 (see the last column in Table 1). The dotted green vertical line in the spectra indicates the central frequency, and the two dashed red lines indicate the determination of the velocities of the red and blue wings. In the example here, the velocity derived for the SiO line (v(SiO) = 26.4 km s−1) is larger than the velocity determined from the low resolution CO v = 0 J = 2 − 1 line (v(CO) = 21.8 km s−1). Bottom row: The first image is the moment0 map, the second image the 2D Gaussian fit to the moment0-map, and the last plot the image for the deconvolved 2D Gaussian profile. The colour scales in the moment0 maps are in units of Jy/beam km s−1. The ALMA synthesized beam is shown as a white ellipse in the lower left corner of the moment0 map.
3 is plotted (right panel). The velocity (in km s−1) is with respect to the stellar velocity of −16.3 km s−1 (see the last column in Table 1). The dotted green vertical line in the spectra indicates the central frequency, and the two dashed red lines indicate the determination of the velocities of the red and blue wings. In the example here, the velocity derived for the SiO line (v(SiO) = 26.4 km s−1) is larger than the velocity determined from the low resolution CO v = 0 J = 2 − 1 line (v(CO) = 21.8 km s−1). Bottom row: The first image is the moment0 map, the second image the 2D Gaussian fit to the moment0-map, and the last plot the image for the deconvolved 2D Gaussian profile. The colour scales in the moment0 maps are in units of Jy/beam km s−1. The ALMA synthesized beam is shown as a white ellipse in the lower left corner of the moment0 map.
Current usage metrics show cumulative count of Article Views (full-text article views including HTML views, PDF and ePub downloads, according to the available data) and Abstracts Views on Vision4Press platform.
Data correspond to usage on the plateform after 2015. The current usage metrics is available 48-96 hours after online publication and is updated daily on week days.
Initial download of the metrics may take a while.