Fig. 11.
Download original image
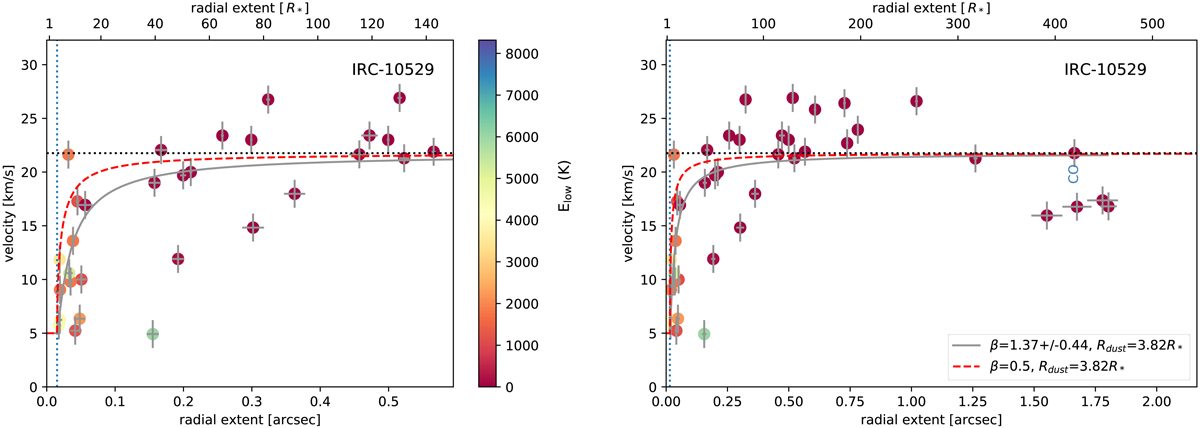
Wind kinematics for IRC −10529. The wind velocities for all the molecular transitions observed in the low, medium, and high spatial resolution observations of IRC −10529 derived by the methodology described in Sect. 5.2. The velocities are plotted versus half of the spatial full-width-half-maximum (FWHM) of the molecular emission zone, and represent the dominant line formation region (Decin et al. 2018). The dotted blue vertical line indicates the radius at which the winds begin being accelerated (Rdust in Eq. (4); see Sect. 5.4), and the dotted black horizontal line is the velocity measure of the 12CO v = 0 J = 2 − 1 line. Only emission zones which could be spatially deconvolved are plotted (as dots) – the colour of the symbols are related to the energy of the lower state as indicated by the colour code bar. The grey cross on top of each coloured dot indicates the error bar in the derived velocity and in the FWHM, and is often smaller than the size of the dots. The error bars represent the fitting margin. Not accounted for here are the uncertainties due to the Gaussian approximation which might result in a systematic underestimate of the angular extent (see Sect. 5.2). The bottom axis is in units of arcseconds and the top axis is in units of the stellar radius. Left hand panel: zooms into the 150 stellar radii of the circumstellar envelope, and right hand panel: full extent of the detected wind emission. The 12CO v = 0 J = 2 − 1 transition (indicated in blue) only appears in the right hand panel owing to its large angular extent. The deconvolved data with a velocity less than that of the 12CO J = 2 − 1 transition, were fitted with a β-velocity law (Eq. (4)). Indicated in the legend in the right hand panel is β. The fit is represented by the full grey line which can be compared with a β-velocity law for β = 0.5 indicated by the red dashed line.
Current usage metrics show cumulative count of Article Views (full-text article views including HTML views, PDF and ePub downloads, according to the available data) and Abstracts Views on Vision4Press platform.
Data correspond to usage on the plateform after 2015. The current usage metrics is available 48-96 hours after online publication and is updated daily on week days.
Initial download of the metrics may take a while.