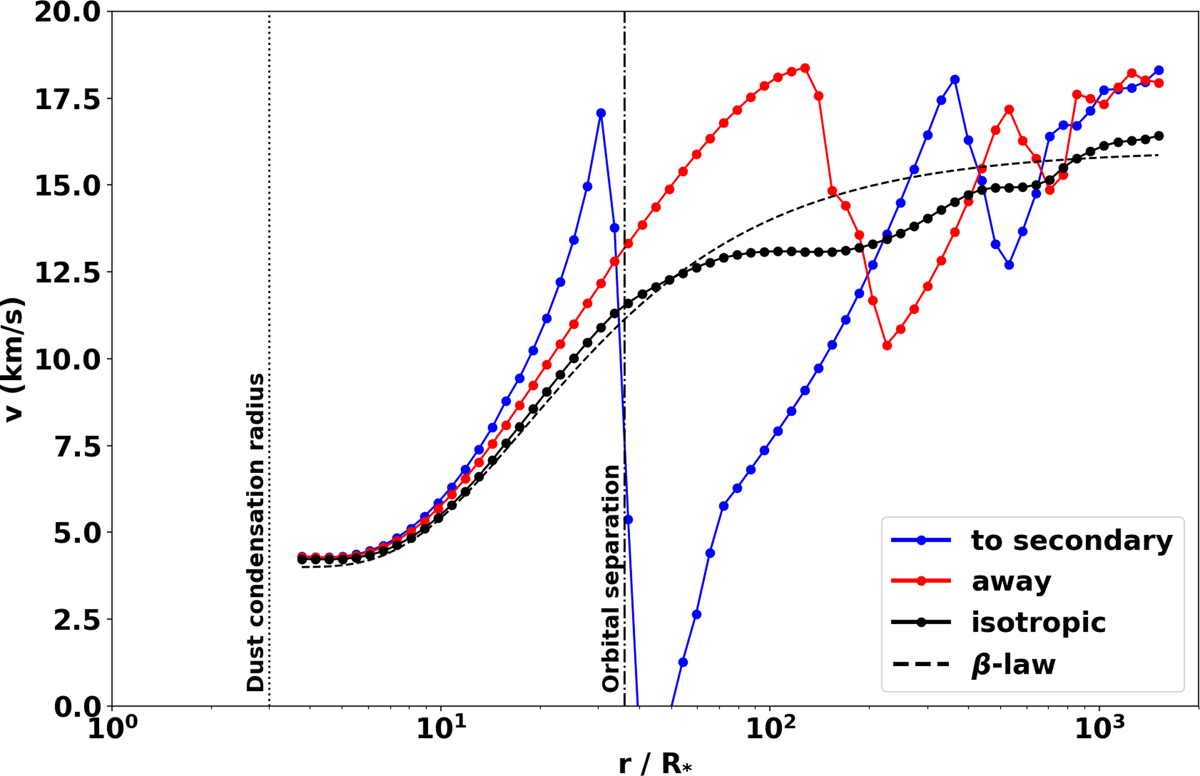
Fig. 10.
Download original image
Illustration of the impact of a binary companion on the velocity field. Given the simulations shown in Fig. 9 (El Mellah et al. 2020), the dotted black line represents the 1D isotropic radial velocity profile (w.r.t. the star). The dotted blue line is the radial velocity profile in the direction of the secondary, and the dotted red line is the radial velocity profile in the direction opposite to the secondary. For comparison, the dashed black curve illustrates the β-velocity law (Eq. (4)) for β = 5 representing the single-star situation. For better comparison with the observed velocity profiles (Sect. 5.2), the same figure but with a linear x-axis is shown in Fig. A.1. See text for more details.
Current usage metrics show cumulative count of Article Views (full-text article views including HTML views, PDF and ePub downloads, according to the available data) and Abstracts Views on Vision4Press platform.
Data correspond to usage on the plateform after 2015. The current usage metrics is available 48-96 hours after online publication and is updated daily on week days.
Initial download of the metrics may take a while.