Fig. 1.
Download original image
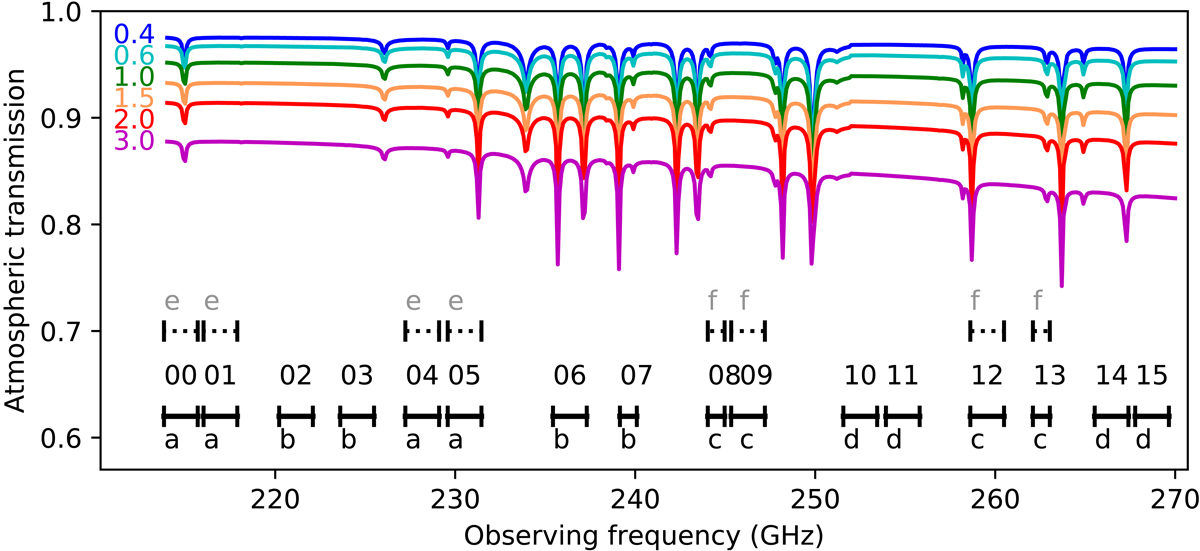
Frequency coverage of the ATOMIUM project in each array configuration (see Sect. 3.1 and Table 2). Each black bar represents the frequency coverage of a spectral window (spw), labelled with the same index number as in our final released data products. The solid lines and letters a–d represent the frequency tunings for the medium and extended configurations; the dotted lines and grey letters e, f represent the frequency tunings for the compact configuration. The exact spectral coverage for each target depends on the adjustment to the assumed vLSR on the dates of observation (see Table 1). Each frequency tuning covered 4 spws grouped as follows: [00,01,04,05], [02,03,06,07], [08,09,12,13], and [10,11,14,15]. The first (second) pair of spw in each frequency tuning corresponds to the lower (upper) sideband in which the channel numbering is in descending (ascending) frequency order. The coloured lines represent the atmospheric percentage transmission labelled by the precipitable water vapour (PWV), in mm.
Current usage metrics show cumulative count of Article Views (full-text article views including HTML views, PDF and ePub downloads, according to the available data) and Abstracts Views on Vision4Press platform.
Data correspond to usage on the plateform after 2015. The current usage metrics is available 48-96 hours after online publication and is updated daily on week days.
Initial download of the metrics may take a while.