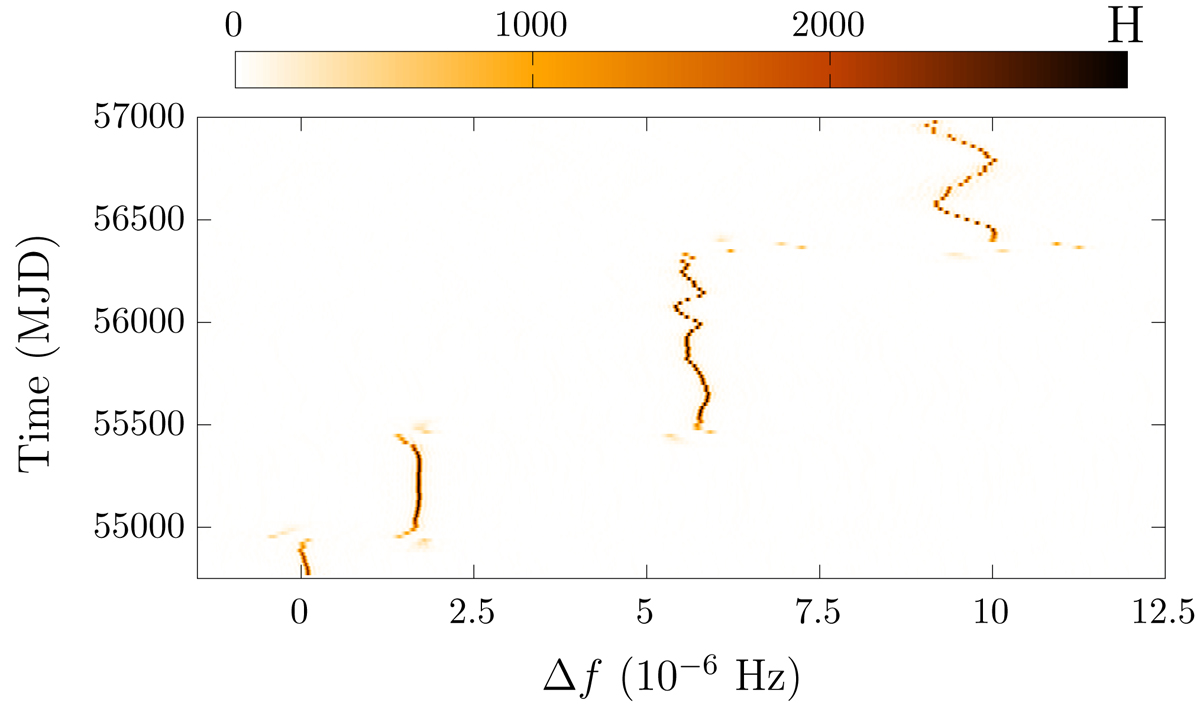
Fig. 1.
Download original image
Pulsar glitch analysis for PSR J0007+7303. The weighted H-test is calculated according to Eq. (2) using photons within the 170-day time window sliding over the entire data set with 17-day steps. For each window scans over f and ḟ were performed. The maximum value of H to ḟ for a given f is color-coded (see color scale at top). The vertical axis shows the time midpoint of each time window. The horizontal axis shows the offset in f.
Current usage metrics show cumulative count of Article Views (full-text article views including HTML views, PDF and ePub downloads, according to the available data) and Abstracts Views on Vision4Press platform.
Data correspond to usage on the plateform after 2015. The current usage metrics is available 48-96 hours after online publication and is updated daily on week days.
Initial download of the metrics may take a while.